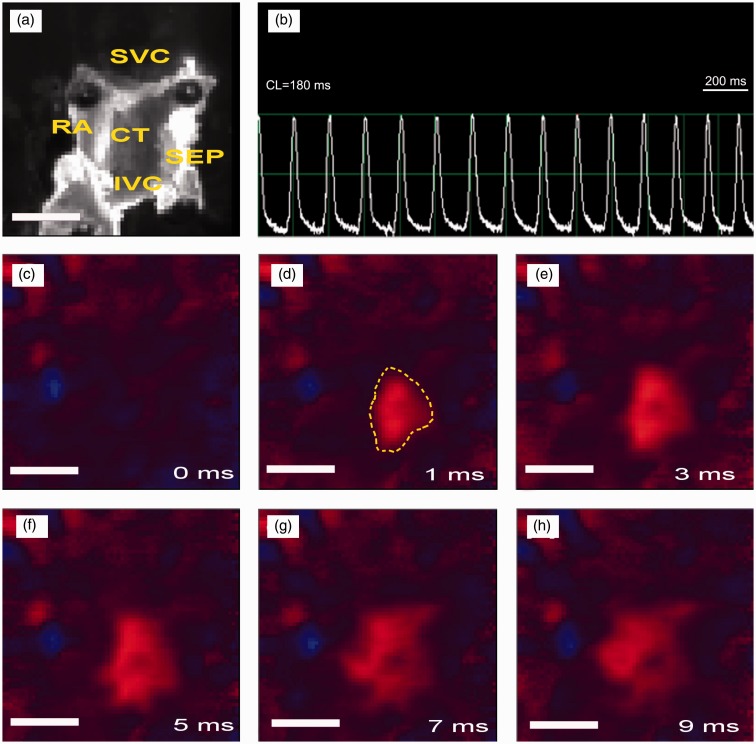
Figure 5.
Optical mapping over rat SAN preparation (from the young group). (a) Image of the raw SAN preparation. CT: crista terminalis; IVC: inferior vena cava; RA: right atrium; SEP: septum; SVC: superior vena cava. (b) Representative optical signals recorded at the leading pacemaking site. CL = cycle length. (c to h) Activation sequence over SAN from 0 to 9 ms. The area surrounded by yellow line in d is the leading pacemaker site which was harvested for further Western blot assay. Scale bar = 5 mm. (A color version of this figure is available in the online journal.)

