
Figure 4. ELKS1α/2α control RRP at excitatory synapses.
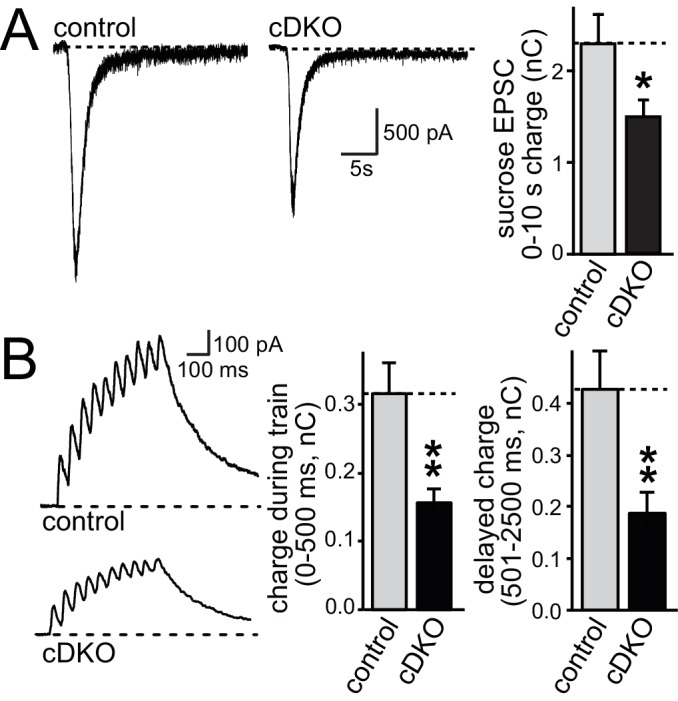
(A) Sample traces showing AMPAR-EPSCs in response to superfusion with 500 mOsm sucrose (left). The bar graph on the right shows the AMPAR-EPSC charge transfer, quantified as the area under the curve during the first ten seconds of the response (control n = 30/3, cDKO n = 29/3). (B) Sample traces (left) of NMDAR-EPSCs during a short action potential train (10 stimuli at 20 Hz). The charge transfer during the train and in the two seconds immediately after the train is quantified separately on the right (control n = 14/3, cDKO n = 14/3). All data are means ± SEM; *p≤0.05, **p≤0.01 as determined by Student's t test.