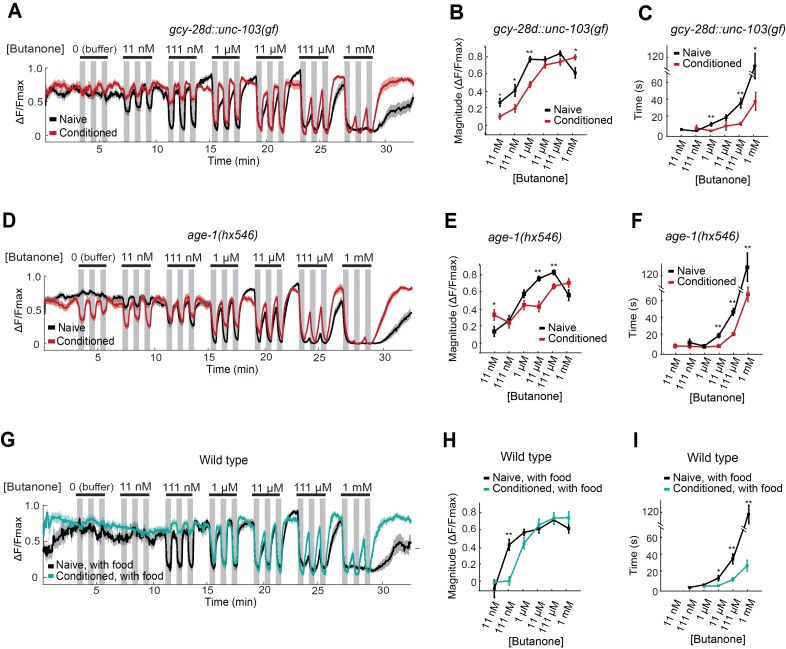
Figure 5. AWCON butanone responses report odor history.
(A–F) AWCON calcium responses are altered by aversive conditioning in mutants that do not learn. (A–C) gcy-28d::unc-103(gf) (D–F) age-1(hx546). (G–I) AWCON calcium responses of wild-type animals after appetitive conditioning with odor and food. Note that the well-fed naive and conditioned groups in (G–I) are less sensitive to odor than the food-deprived groups in Figure 4. (A,D,G) Calcium responses to a concentration series with three 30 sec pulses per concentration. Gray represents odor. (B,E,H) Average response magnitude after butanone addition (first of three pulses). (C,F,I) Half-time of recovery after butanone removal (last pulse). n = 11–24 animals. P values were generated by t-test at each odor concentration with correction for unequal variance (**p<0.001, *p<0.05). Error bars in (B,C,E,F,H,I) and shaded regions in (A,D,G) represent S.E.M.
DOI: http://dx.doi.org/10.7554/eLife.14000.012

