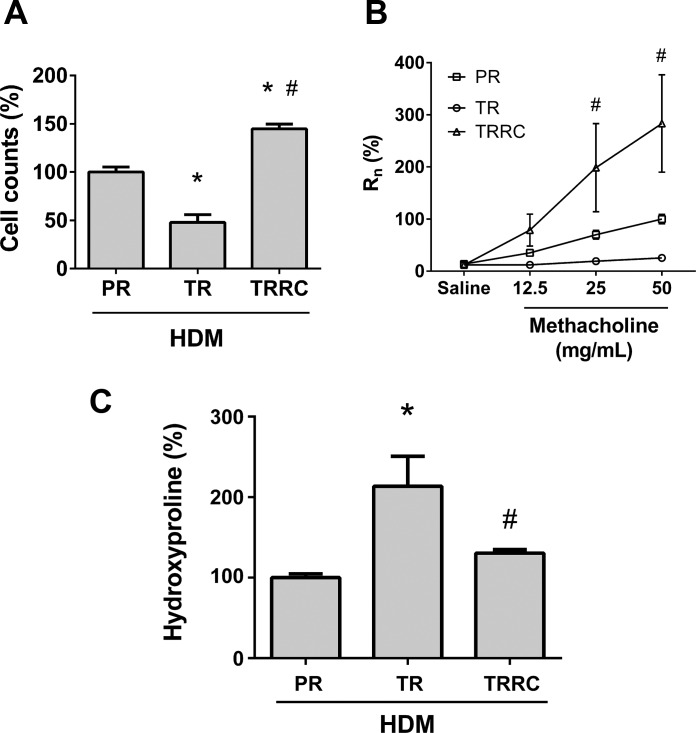
Fig. 13.
Comparison of total cell counts and AHR between HDM-challenged mice. A: percentage of difference in total cell counts in HDM-challenged mouse BALF from preventive (PR) and therapeutic (TR) regimen and therapeutic regimen with subsequent HDM rechallenge (TRRC) experiments. *P < 0.05 compared with PR and #P < 0.05 compared with TR. B: percent difference in methacholine-induced central airway resistance (Rn) of HDM-challenged mice from preventive and therapeutic regimen and therapeutic regimen with subsequent HDM rechallenge experiments. #P < 0.05 compared with TR. C: percent difference in hydroxyproline content of HDM-challenged mice from preventive and therapeutic regimen and therapeutic regimen with subsequent HDM rechallenge experiments. *P < 0.05 compared with PR and #P < 0.05 compared with TR.

