Fig. 1.
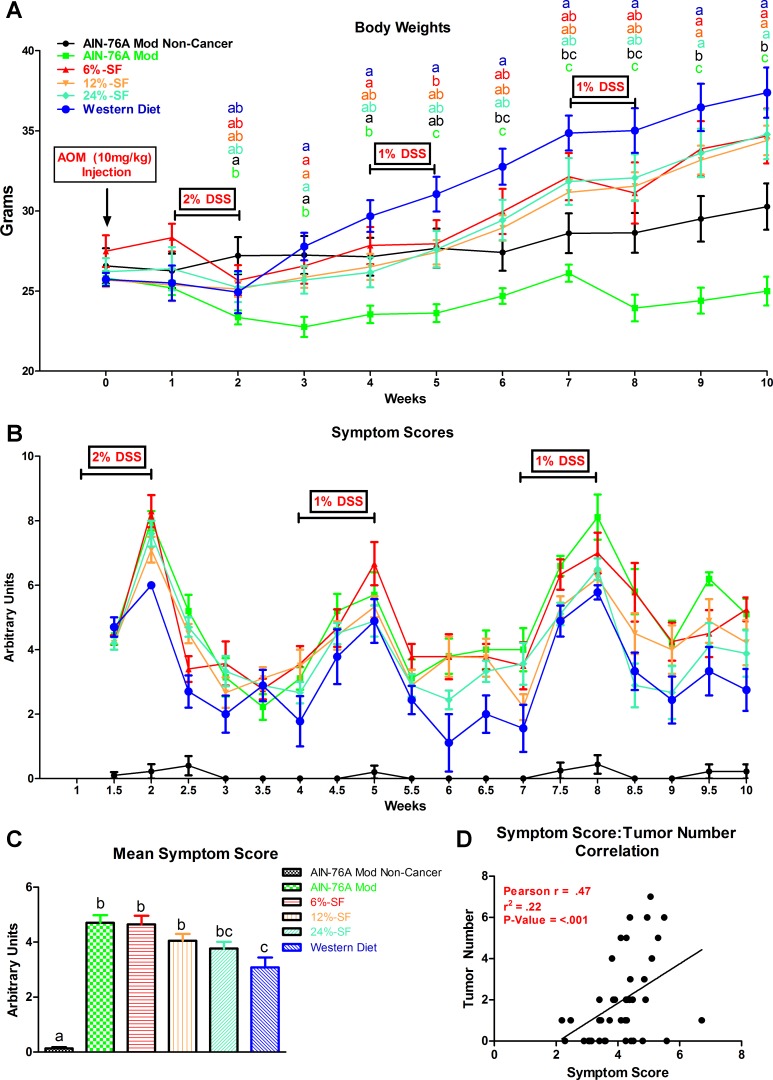
Influence of the azoxymethane (AOM)/dextran sulfate sodium (DSS) model on body weights (A), symptom scores (B), mean symptom score data over the course of the study (C), and symptom score-tumor number correlational analysis (D) (n = 8–10/group). Groups not sharing a common letter differ significantly from one another (P ≤ 0.05).

