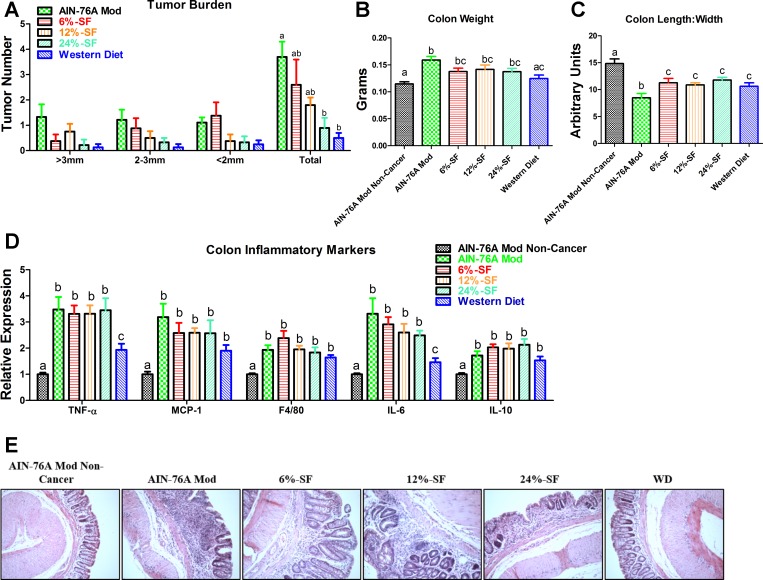
Fig. 2.
Tumor and colon inflammatory data from experiment 1. Shown are tumor burden (A), colon weight (B), colon length-to-width ratio (C), colon inflammatory markers (D), and representative colonic hematoxylin and eosin (H&E) images (E) (×20) of each treatment group (n = 8–10/group). SF, saturated fat; WD, Western diet. Groups not sharing a common letter differ significantly from one another (P ≤ 0.05).

