Fig. 2.
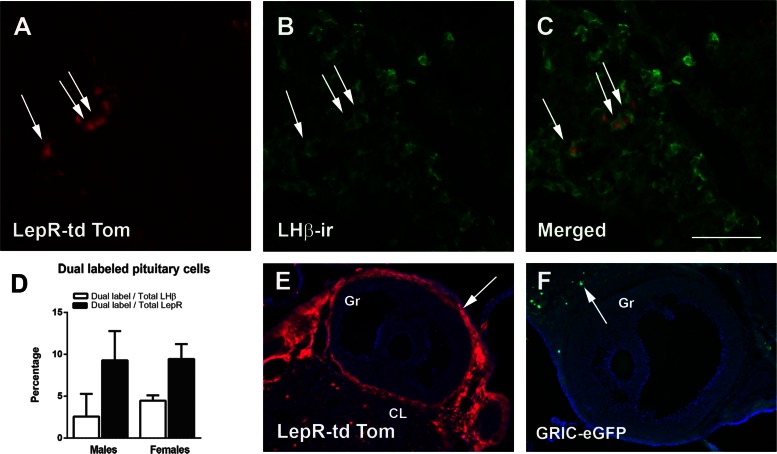
Leptin receptor (LepR) is expressed in a subpopulation of cells expressing GnRHR in the pituitary gland. A–C: fluorescent images showing that subsets of LepR-expressing cells (LepR-Cre tdTomato; A) display LH-β immunoreactivity (LH-β-ir; B) in males (arrows indicate dual-labeled cells). C: merged. D: bar graphs showing the percentage of colocalization between LepR-tdTom and LH-β-ir in the pituitary gland of male and female mice (n = 3 males and n = 5 females). E and F: fluorescent images showing the distribution of LepR-reporter gene (tdTom; E) (arrows mark these cells) and GRIC-reporter gene (eGFP; F) (arrow indicates a cell in the parenchyma) in the mouse ovary. CL, corpus luteum; Gr, granulosa layer. Scale bar: 100 μm in A–C and 200 μm in E and F.

