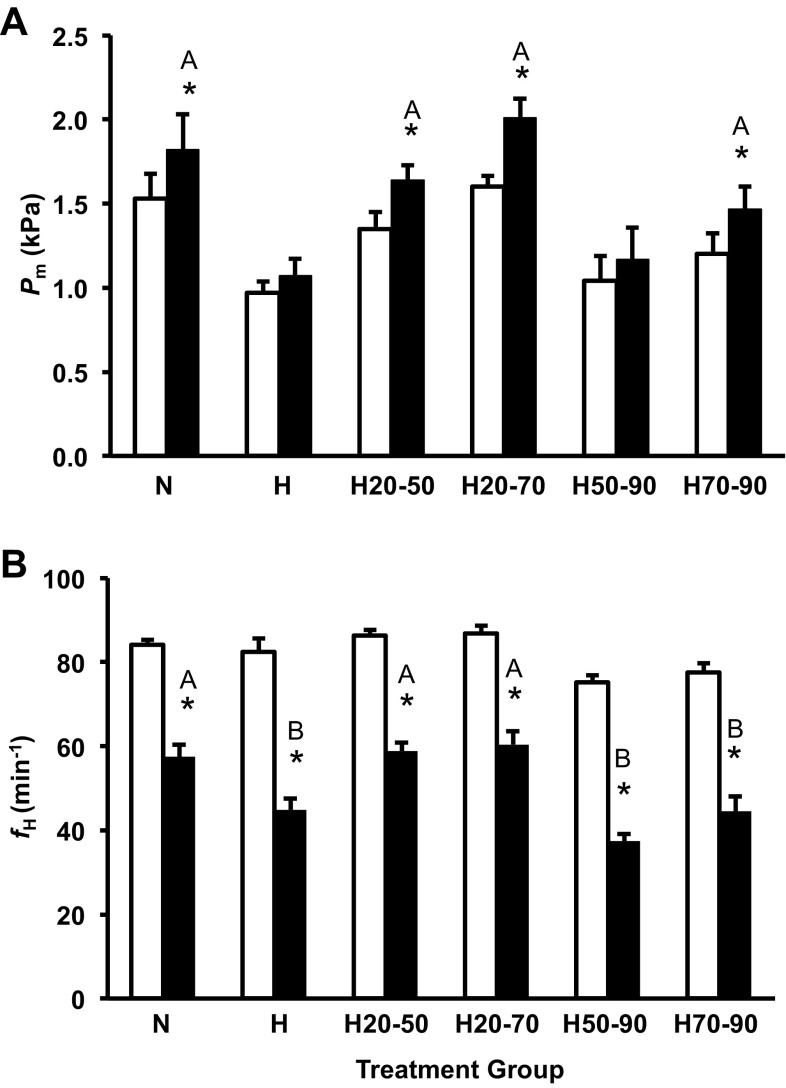
Fig. 5.
Pm (A) and fH (B) for the control group, and all shifted groups pre- (open column) and post-β-adrenergic (solid columns) blockade in alligator embryos at 90% of incubation. Groups were either maintained in normoxic conditions (N), 10% O2 conditions (H), or shifted as follows: from 21 to 10% O2 at 50% of incubation (H50-90), from 10% to 21% O2 at 50% of incubation (H20-50), from 21 to 10% O2 at 70% of incubation (H70-90), or from 10% to 21% O2 at 70% of incubation (H20-70). Asterisks indicate a significant response to β-adrenergic blockade (P < 0.05). Dissimilar letters in the groups indicate statistically distinct differences in the response intensity between compared groups. Data are presented as means ± SE. Sample sizes N (n = 9), H (n = 5), H50-90 (n = 12), H20-50 (n = 12), H70-90 (n = 8), and H20-70 (n = 9).

