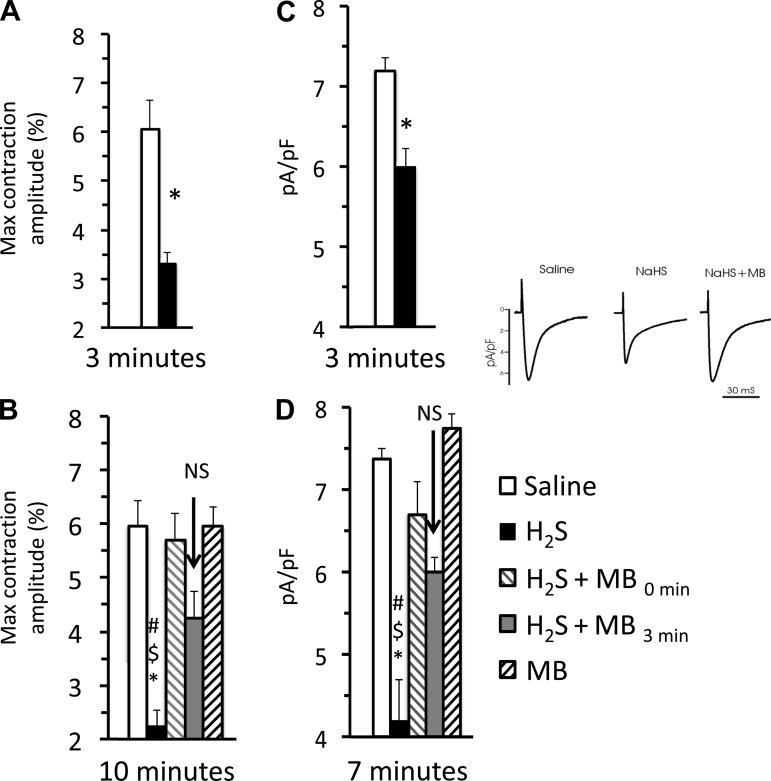
Fig. 12.
A, left: effect of H2S on cardiac contractility determined 3 min after the onset of exposure. Contractility was already significantly depressed. B: at time 0, myocytes were exposed to saline, H2S (100 μM), H2S, and MB or MB alone (20 μg/ml), and then maximum contraction amplitude was determined at 10 min. In addition at 3 min, MB (20 μg/ml, gray bar) was added to the cells that were exposed to H2S solution at time zero, and the contractility was measured at 10 min (7 min after MB rescue). The number of myocytes analyzed was 7 for the saline exposure, 9 for H2S, 8 for H2S -MB, 10 for MB alone, and 9 H2S followed by MB at the 3rd min of exposure. Note that methylene blue was effective even when given after H2S toxicity was established. C, right: effect of H2S ICa 3 min after exposure to H2S (n = 5); ICa was already significantly depressed at 3 min. D: MB ameliorates the inhibition of L-type Ca2+ channel current (ICa) in adult myocytes exposed to H2S. ICa was measured in isolated adult cardiomyocytes under patch-clamp (holding potential −90 mV), in solutions that were Na+- and K+-free (see methods). To ensure steady-state sarcoplasmic reticulum Ca2+ load, 6 conditioning pulses (from −70 to 0 mV, 100 ms, 2 Hz) were delivered before the arrival of each test pulse (from −90 to +50 mV, 60 ms). The legend is the same as on the left panel except for the last measurements of ICa (−10 mV) that were made at 7 instead of 10 min. Six cells were exposed to H2S-saline, 6 cells were exposed to H2S + MB, two cells were exposed to MB alone, and 8 cells were exposed to H2S followed by MB 3 min later were studied. Significant different from saline, #P < 0.01. Significant different from H2S + MB, $P < 0.01. Significantly different from H2S followed by MB at the 3rd min of exposure, *P < 0.05. Inset: representative ICa traces (at −10 mV) from myocytes exposed to saline, H2S (100 μM) and H2S + MB (20 μg/ml) for 3 min.

