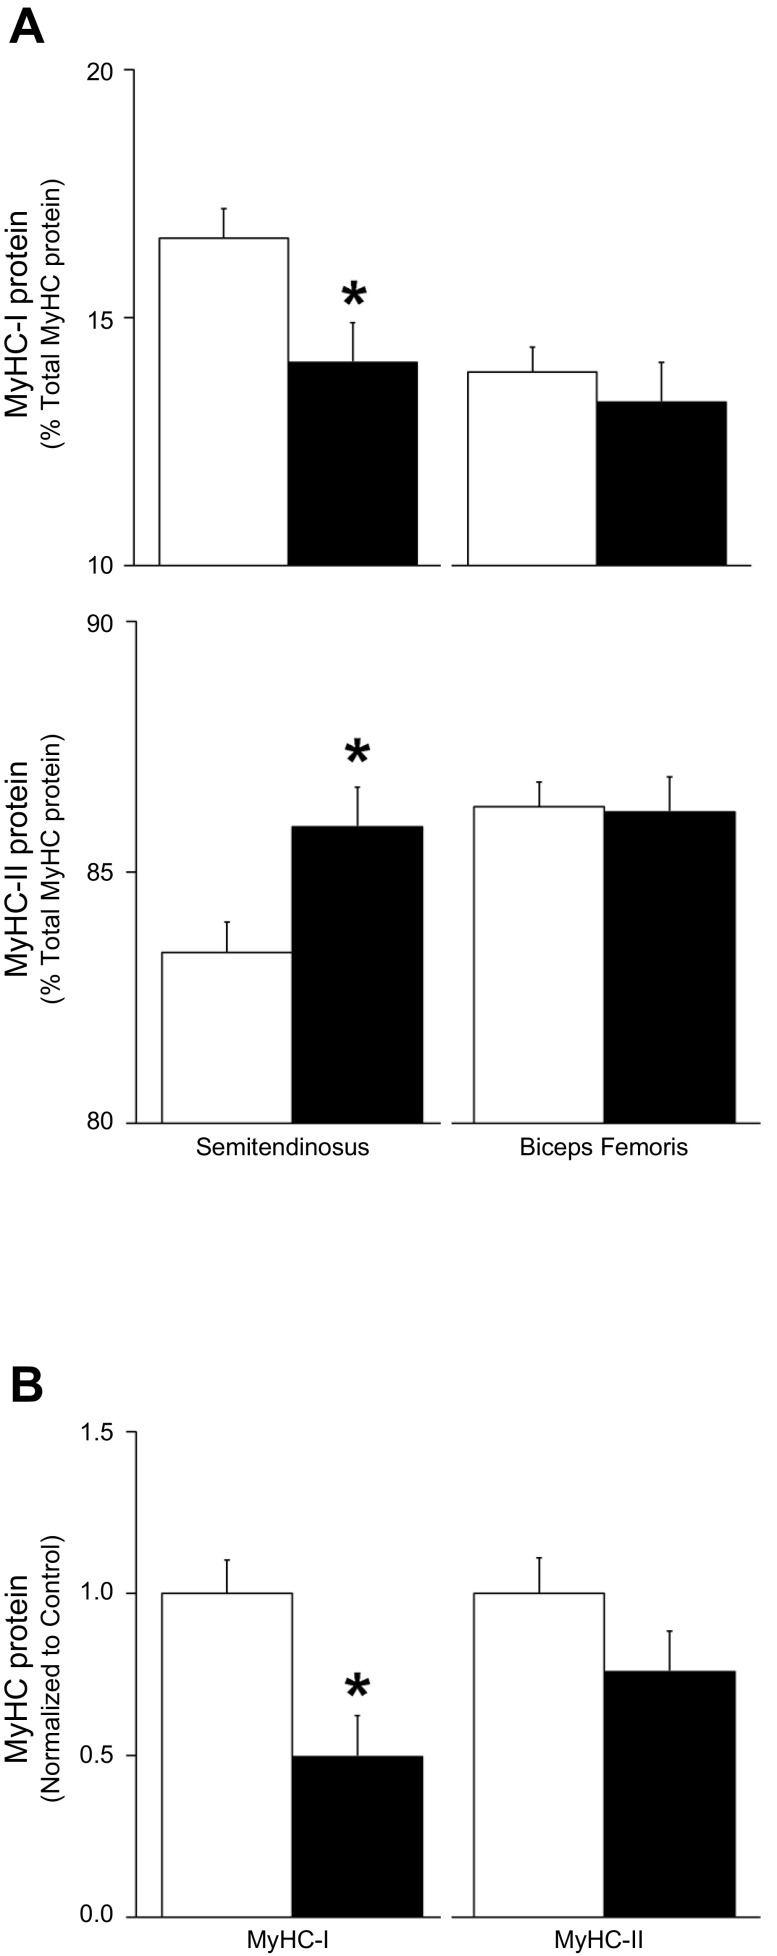
Fig. 4.
Myosin heavy chain protein content. Control, open bars; IUGR, black bars. A: electrophoretic mobility was used to separate MyHC-I and MyHC-II fractions of total protein isolated from control and IUGR semitendinosus and biceps femoris samples. The percentage of total MyHC protein (means ± SE) for MyHC-I and MyHC-II protein content are presented. *Differences (P < 0.05) between control and IUGR groups within each muscle. B: semitendinosus MyHC-I and MyHC-II protein content was measured by immunoblot and normalized to β-tubulin content and expressed as the relative density compared with controls (means ± SE). *Differences (P < 0.05) between control and IUGR groups.

