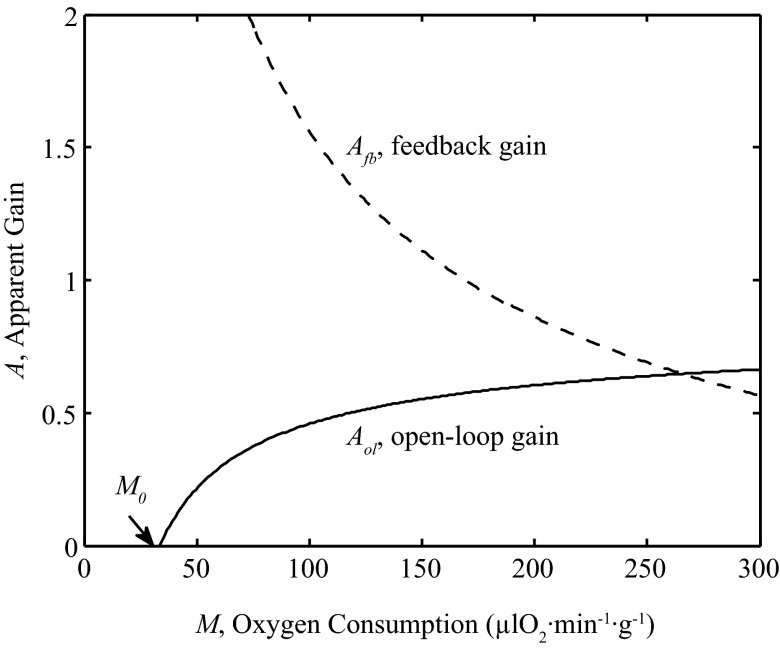
Fig. 13.
Contributions of open-loop and feedback gains. The apparent open-loop gain (Aol: solid line), defined by Eq. 12, and apparent feedback gain (Afb: dashed line), defined by Eq. 13, are plotted as functions of M under physiological control condition. For these simulations, the model uses the parameters from Table 1 with pressure given by P = (0.0001 mmHg·μl O2−1·min1·g1) M + 105.41 mmHg.

