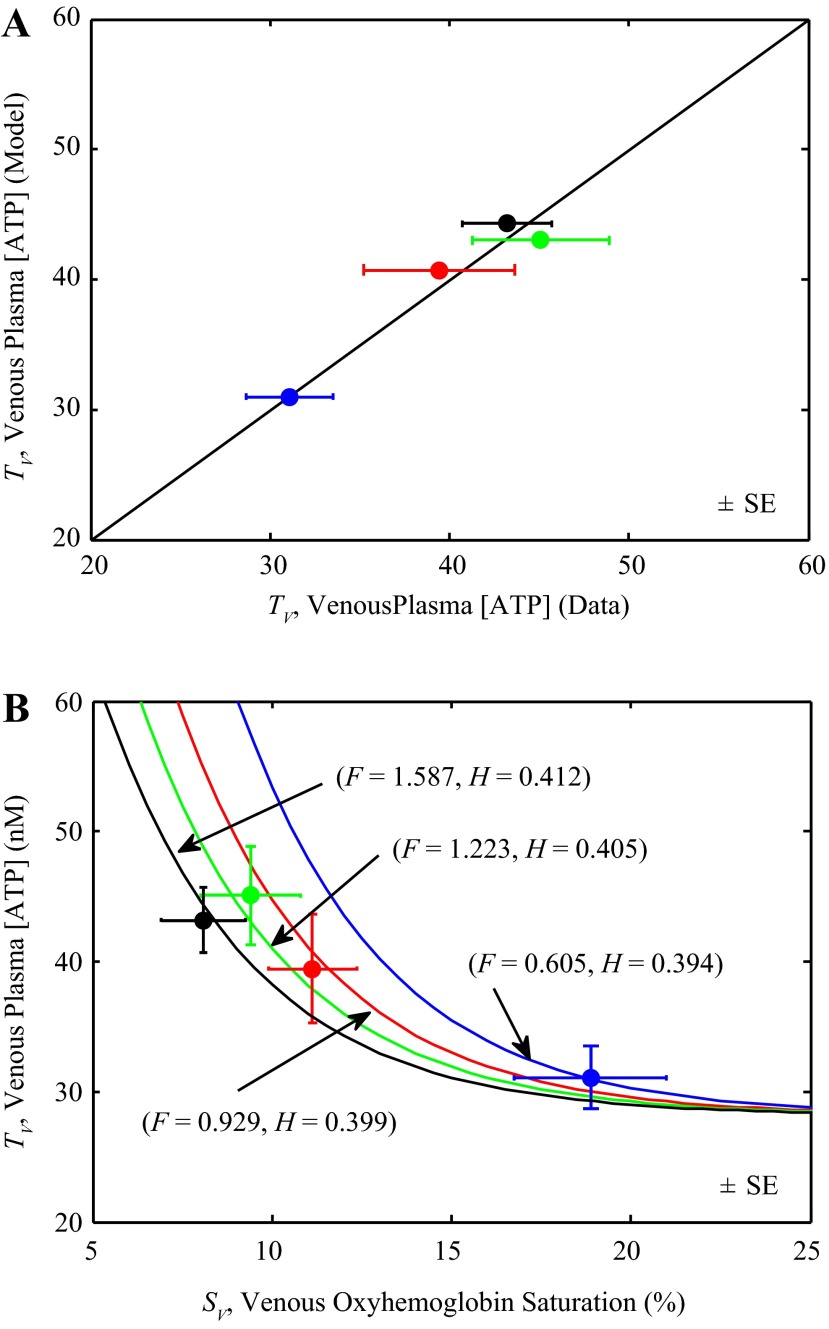
Fig. 3.
Identification of block 1. A: model-predicted coronary venous plasma [ATP], TV, is compared to experimental data (closed circles) of Farias et al. (15). B: coronary venous plasma [ATP] is plotted as a function coronary venous oxyhemoglobin saturation (%). Model simulations of Eq. 4 are compared to data of Farias et al. (15), measured from rest to exercise. Each data point represents mean of data from 10 animals measured at one of four different experimental conditions: rest and three different exercise levels. Since a distinct value of flow F (ml·min−1·g−1) and hematocrit H is associated with each data point, the model simulates a distinct curve in the TV vs. SV relationship for each pair of F and H.

