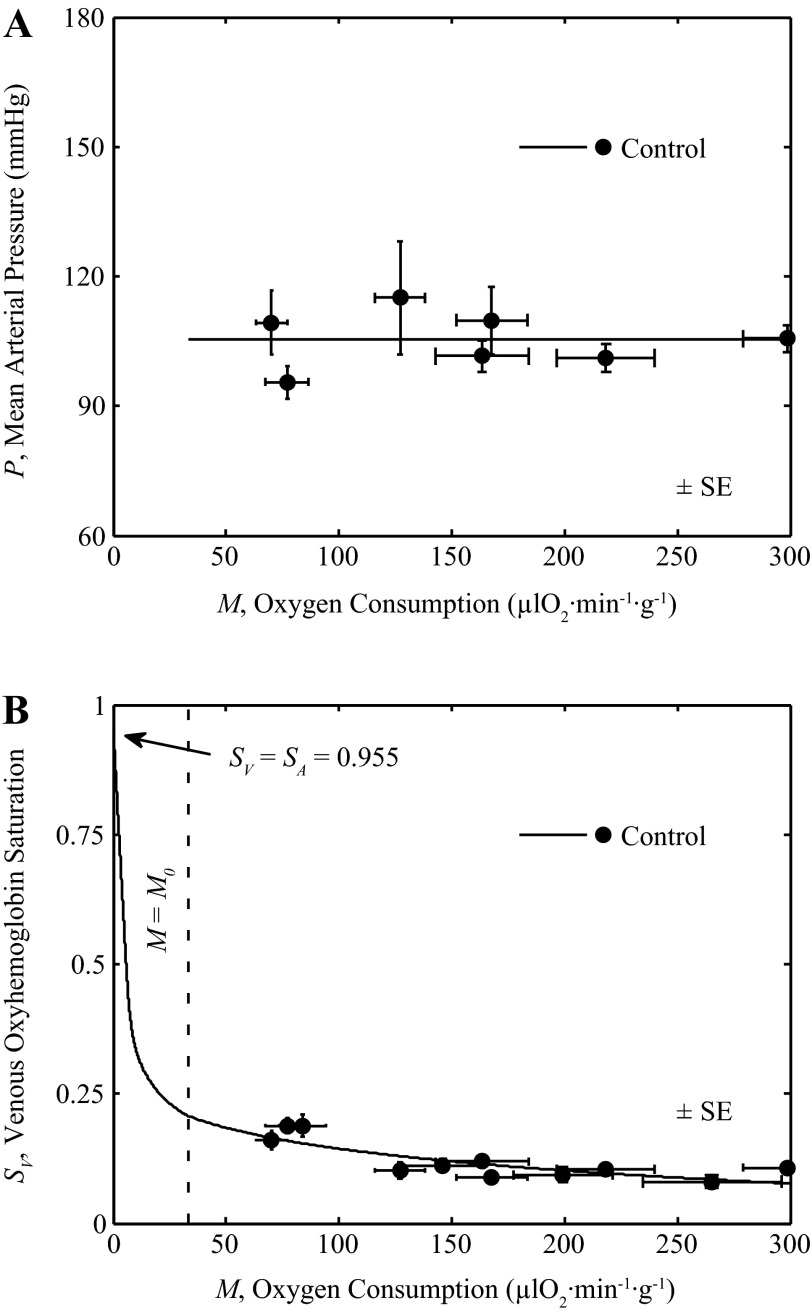
Fig. 6.
Integrated model behavior for control condition. Output of integrated model of Fig. 2 is compared to in vivo data on venous oxyhemoglobin saturation and myocardial oxygen consumption. A: mean arterial pressure as a function of M is plotted for control conditions, measured from rest to exercise (22, 23). A straight line fit is used to set P for the control model. B: the output of the integrated model is compared to the experimental data on SV vs. M, measured from rest to exercise, under control conditions (15, 22, 23).

