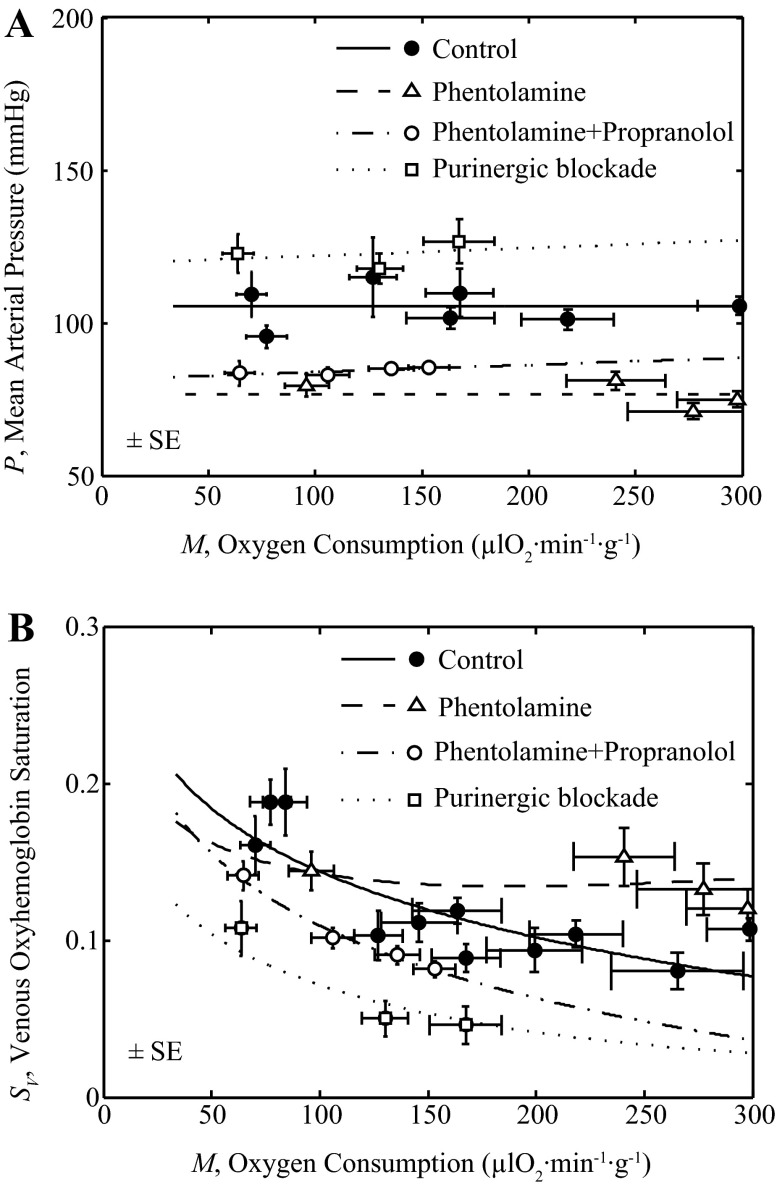
Fig. 7.
Analysis of pharmacological blockade data. Fits to data from control, from phentolamine, from phentolamine + propranolol, and from purinergic block experiments are illustrated. Control data and model fits are identical to those of Fig. 6. Data are from Gorman et al. (22–24) and Farias et al. (15) under control, α-adrenoceptor blockade (phentolamine), and β-adrenoceptor blockade (phentolamine + propranolol) (23), and from Gorman et al. (22) under purine receptor blockade. The control model is adjusted by reducing Kol to 75% of its control value (see Table 1) to fit the phentolamine data and to 6.67% of its control value to fit the phentolamine + propranolol data. The feedback gain Kfb was set to 8.27% of its control value to fit purinergic block data. A shows the fits of P vs. M to the data obtained under these four conditions. B shows the fits of the model to Sv vs. M data, including error estimates (±SE) for SV and M measurements.

