Fig. 7.
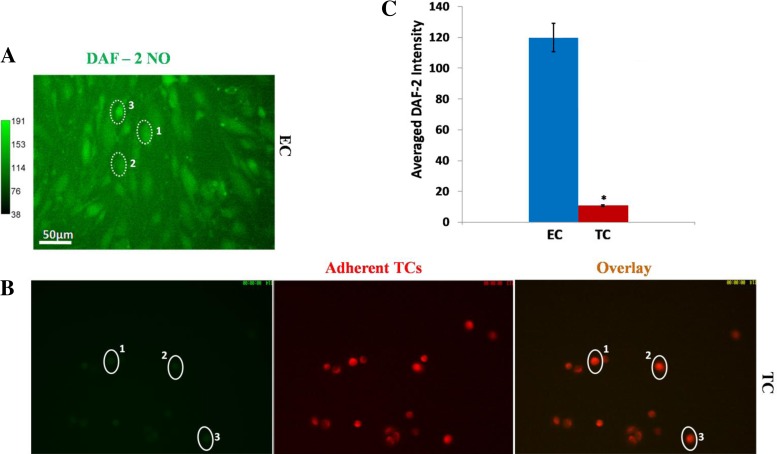
DAF-2 NO images in ECs of bEnd3 monolayer (A) and TCs (B) under normal flow (or equivalent 3 dyn/cm2 wall shear stress) for 30 min. In B, the left image shows the DAF-2 NO image of TCs, the middle one shows the TCs, and the right one is the overlay of the left and middle images. Three typical ROIs, dotted- or solid line-enclosed oval-shaped regions (∼40 μm for the long axis and 25 μm for the short axis) 1, 2, 3 in A and B, are for NO production quantification in ECs and TCs. Three experiments were done for each cell type. Four regions of ∼750 × 560 μm were taken from each experiment. Seventy to eighty ROIs were chosen on each region. B: comparison of NO production in ECs and TCs under normal flow. The averaged DAF-NO intensity is for the ROIs over 3 experiments for each cell type. *P < 0.05, compared NO production in TCs with that in ECs. Values are means ± SE.

