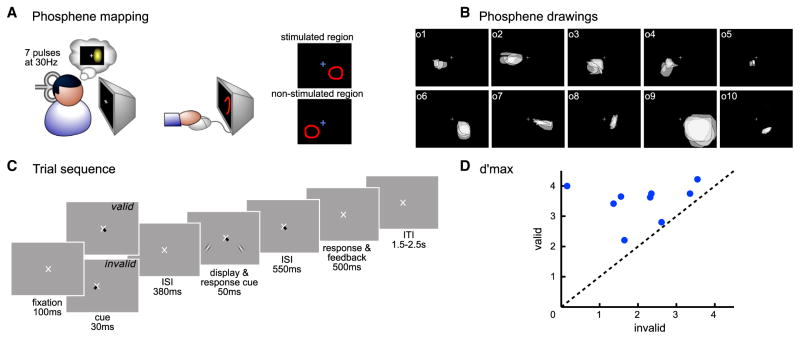
Figure 1. Experimental Paradigm.
(A) Phosphene mapping session. Observers were stimulated in either the right or left occipital pole and drew their perceived phosphene. The phosphene region (“stimulated region”) and the symmetric region in the contralateral visual field (“non-stimulated region”) were used in the main experiment to determine the stimulus location.
(B) Individuals’ phosphenes. Each box represents the phosphenes of one observer. Each translucent shape represents a phosphene drawing for one TMS session.
(C) Trial sequence in both the psychophysics and TMS sessions.
(D) Each dot represents d′ max (d′ at asymptotic performance) for a single observer in the valid condition plotted as a function of the d′ max in the invalid condition. Dots above the diagonal indicate that performance was higher for the valid than invalid cueing conditions.

