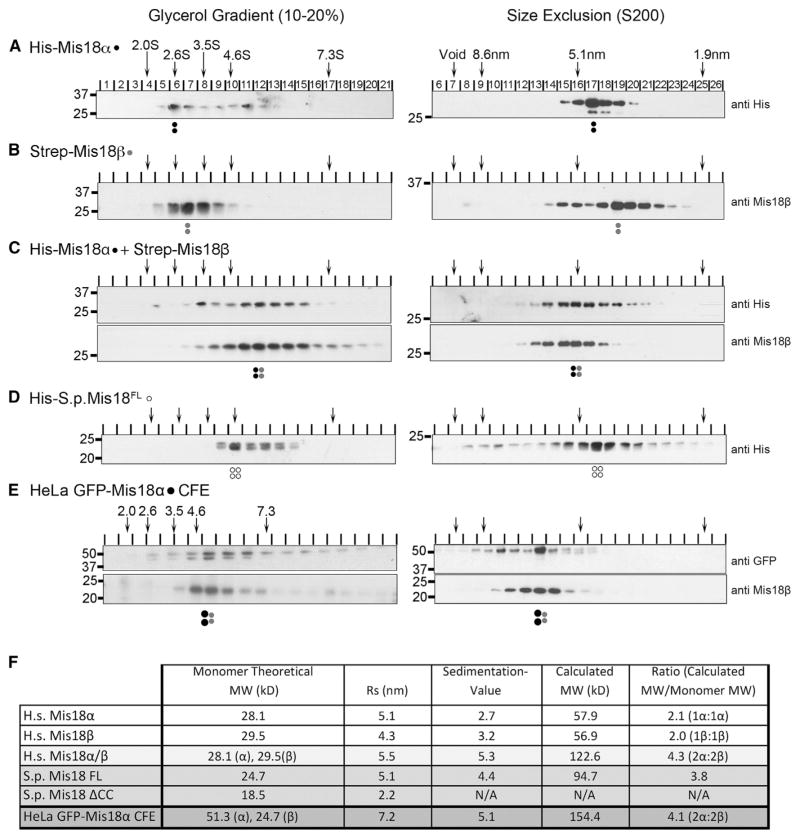
Figure 1. Mis18α and Mis18β Form a Conserved Tetramer.
(A–D) Glycerol gradient sedimentation (left) and SEC (right) performed using recombinant (A) His-tagged Mis18α, (B) Strep-tagged Mis18β, (C) Mis18α and Mis18β combined, and (D) S. pombe Mis18. Arrows at the top indicate the sedimentation values (S) and Stokes radii (nm) of standards. Proteins were detected by immunoblot, and antibodies used are shown to the right. Dots signify the peak fractions and the proteins represented: black, Mis18α; gray, Mis18β; open circles, S. pombe Mis18.
(E) Chromatin-free extracts (CFE) from mitotically arrested cells stably expressing GFP-tagged Mis18α were separated on glycerol gradient (left) and SEC S200 column (right) and immunoblotted using anti-GFP and anti-Mis18β.
(F) Table summarizing the hydrodynamic analyses in (A)–(D). Calculated molecular weights were calculated from Stokes radii (Rs) and sedimentation coefficients (Siegel and Monty, 1966). Stokes radii and sedimentation values were calculated from linear standard curves (Figures S1A–S1D). All values are the average of two replicates. Stoichiometry of the individual complexes was determined by dividing the calculated molecular weight of the complex by the theoretical molecular weights of the monomeric proteins based on amino acid content.

