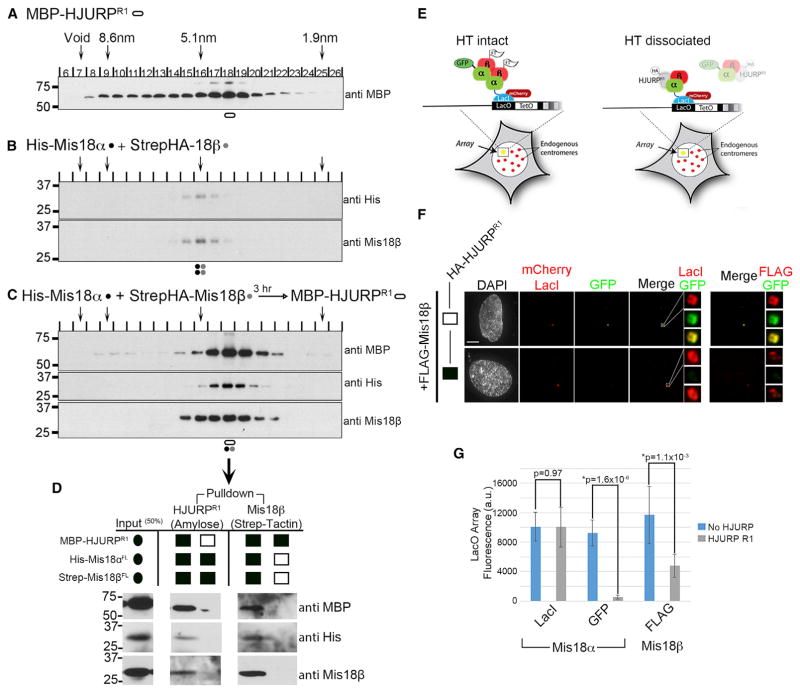
Figure 5. HJURP Disrupts the Mis18α/β HT.
(A–C) SEC was performed on recombinant (A) HJURP fragment (aa 348–555) MBP-HJURPR1, (B) Mis18α + Mis18β, or (C) MBP-HJURPR1 + Mis18α/β (see also Figures S1A, S1D, S1F, and S1G). Stokes radii of standards are indicated by arrows. Proteins were detected by immunoblot. Shapes under the blots identify the peak fractions and the proteins represented: black, Mis18α; gray, Mis18β; open oval, HJURPR1.
(D) In vitro pull-downs of the peak SEC fraction on either amylose or strep-tactin beads showing that the peak complex contains Mis18α, Mis18β, and HJURPR1.
(E) Predicted model of Mis18α/β recruitment and HT disruption in the presence of HJURPR1 at the LacO array.
(F) U2OS-LacO cells were cotransfected with mCLI-Mis18α, GFP-Mis18α, FLAG-Mis18β, and HA-HJURPR1. Cells were stained with an anti-FLAG antibody to determine Mis18β recruitment. The LacO arrays are magnified in the boxed regions to right with either GFP-Mis18α (left) or FLAG-Mis18β (right). Scale bars, 5 μm.
(G) Fluorescence quantitation of the mCherry (mCLI-Mis18α), GFP (GFP-Mis18α), and FLAG (FLAG-Mis18β) channels without HJURPR1 transfected into the cells. A Student’s two-tailed t test was performed comparing the two conditions in each channel ± SD. p values are noted (see also Figure S5B).

