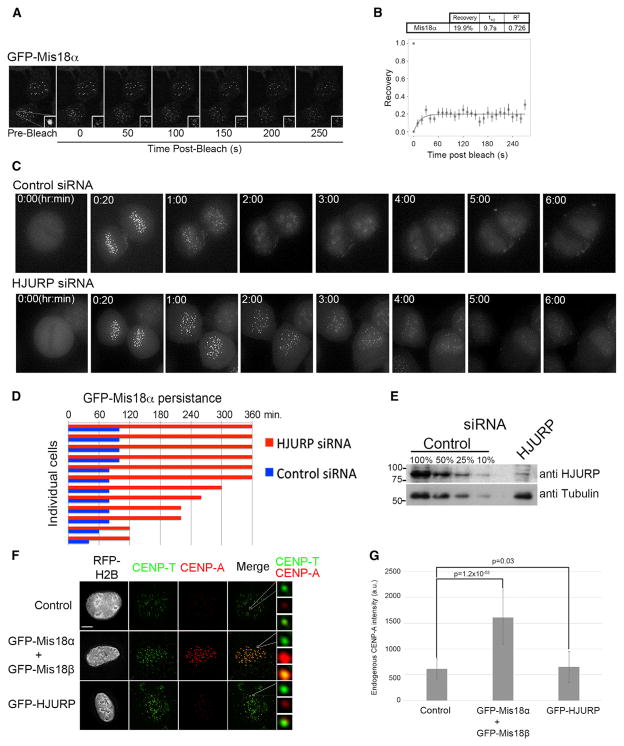
Figure 6. The Stable Pool Mis18α Is Removed from Centromeres Following HJURP Binding.
(A) Representative images of fluorescence recovery after photobleaching (FRAP) of GFP-Mis18α.
(B) Averaged fluorescence recovery values were fitted to an exponential recovery curve, ± SEM.
(C) Live-cell imaging of GFP Mis18α HeLa cells treated with either control or HJURP siRNA. Cells were imaged starting in metaphase when GFP-Mis18α is absent.
(D) Quantitation of the persistence of GFP-Mis18α in centromeric foci in control and HJURP siRNA-treated cells. Cells were examined for Mis18α foci at 20 min intervals following metaphase. Bars indicate the time points during which Mis18 was visible (see also Figure S5C).
(E) Western blot of cell populations from control siRNA and HJURP siRNA-treated cells to assess the efficiency of HJURP suppression.
(F) Parental U2OS cells were transfected with the indicated GFP constructs along with RFP-H2B as a transfection marker. Cells were stained with anti-CENP-T and CENP-A antibodies. Scale bars, 5 μm.
(G) Bar graph of total CENP-A fluorescence between the different conditions, ± SD. p values obtained from a two-tailed t test with a significance level >0.05 (see also Figures S6A–S6G).

