
Figure 2. Greater activation signaling in JR209 TEM compared with TCM.
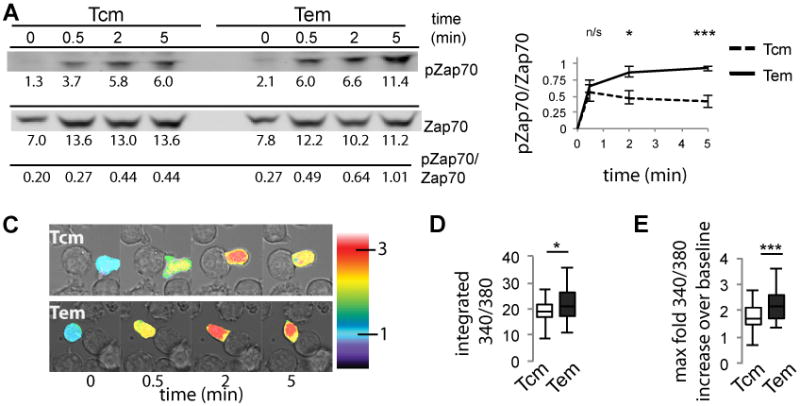
(A) Western blot analysis of phosphorylated Zap-70 of JR209 TCM and TEM following activation by T2-A2Kb APCs loaded with 10μM gp100209-217(2M). Values under blots are background-subtracted integrated intensity of bands × 1/100. (B) Quantification of Western blots for TCM (dashed) and TEM (solid) (n = 6, Two-tailed t test - 0.5 min p = 0.555, 2 min p = 0.012, 5 min p = 0.0004). (C) (A) Live cell imaging of FURA 2-AM-labelled JR209 TCM and TEM measuring relative calcium concentration following conjugation with T2-A2Kb APCs loaded with 10μM gp100209-217(2M) (representative images shown). Calcium concentration relative to time zero – measured as the average whole cell intensity of 340/380 emission intensities – is illustrated by a false color scale indicated by the color bars. (D) Integrated relative calcium concentrations for JR209 TCM and TEM over 5 minutes following T cell/APC conjugation (Means: TCM = 19.0, TEM = 22.0. Data representative of triplicate experiments; TCM n = 49, TEM n = 47, Mann-Whitney test - p = 0.023).(E) Maximum relative calcium concentration above time zero baseline concentration attained over 5 minutes following T cell/APC conjugation, represented as fold increase from baseline value (Means: TCM = 1.80, TEM = 2.21. Data representative of triplicate experiments; TCM n = 49, TEM n = 47, Mann-Whitney test - p < 0.0001).