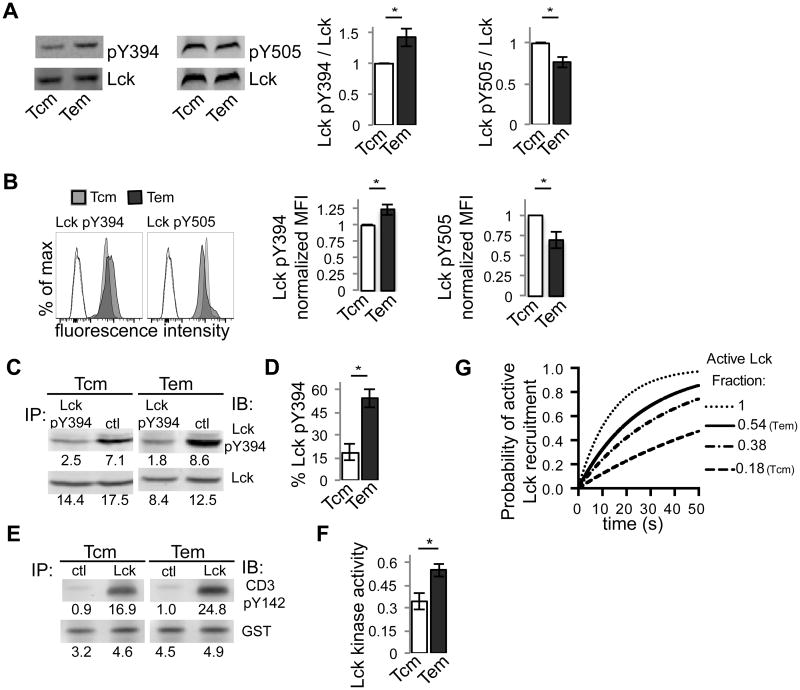
Figure 3. JR209 TCM and TEM have different constitutive Lck phosphorylation and Lck kinase activity.
(A) Western blot analysis of total cell lysate of JR209 TCM and TEM for phosphorylated Lck Y394 and phosphorylated Lck Y505 (representative images shown on left). Quantified data (right) represents intensity of phosphorylated-specific antibody over intensity of total Lck-specific antibody, normalized to unity for TCM (for pY394 n = 13, Two tailed t-test – p = 0.007; for pY505 n = 4, Two tailed t-test - p = 0.036). (B) Flow cytometry of Lck expression in in vivo-generated JR209 TCM (grey) and TEM (black) (representative plots shown on left). Unfilled profiles represent unstained controls for TCM (dashed) and TEM (solid) with the inclusion of APC-labeled secondary Ab. Quantified data (right) represents mean fluorescence intensity normalized to unity for TCM (for pY394 n = 3, Two tailed t-test – p = 0.043; for pY505 n = 3, Two tailed t-test - p = 0.044). (C) Lck Y394 phosphorylation as determined by immunoprecipitation with Lck pY394 or control IgG antibody, followed by Western blot analysis of depleted lysate for pY394 Lck and total Lck. (D) Quantification of Lck Y394 phosphorylation from (C) (n = 4, Two tailed t-test – p = 0.005). (E) Lck kinase activity as determined by immunoprecipitation with Lck or control IgG antibody, followed by incubation with GST-tagged rCD3ζ and ATP and Western blot analysis of pCD3ζ (Y142) and GST. (F) Quantification of rCD3-ζ phosphorylation from (E), normalized to GST (n = 3, Two tailed t-test – p = 0.024). (G) Simulation of the probability of forming an active TCR complex as a function of pMHC-TCR lifetime given the differences in Lck activity between TCM (0.18) and TEM (0.54), based on the “Lck come&stay/signal duration” model [14]. For comparison, complete Lck activity (1.0) and the Lck activity previously calculated [12] for human naïve CD4 T cells (0.38) is also included.

