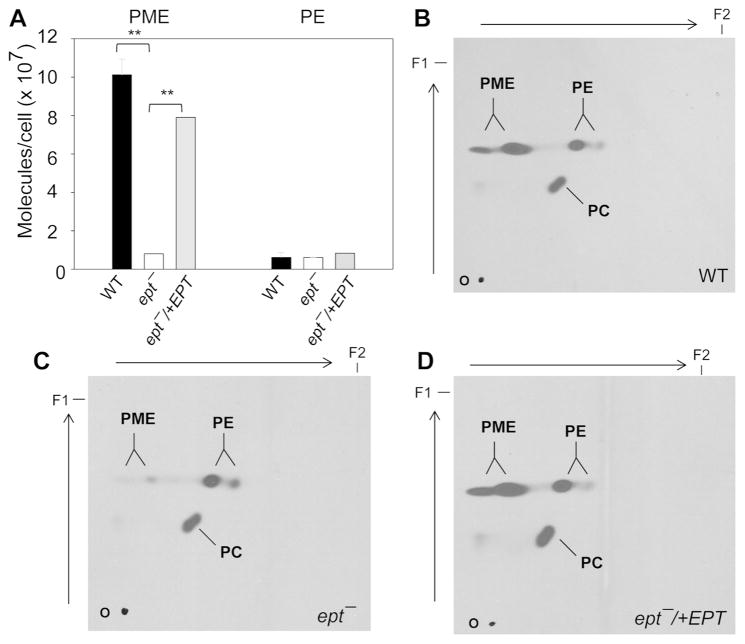
Figure 3. Ept− mutants are defective in PME synthesis.
(A) Total lipids from day 2 stationary phase promastigotes were analyzed by ESI/MS in the negative ion mode. Portions of [M-H]− spectra are shown in Fig. S4. The abundance of PME and PE was summarized and error bars represent standard deviations from three independent experiments. **: p<0.01. (B–D) Log phase promastigotes were labeled with 3H-ethanolamine for 48 hours in complete M199 medium and total lipids (from 107 cells each) were separated by 2D-TLC. First dimension (from bottom to top) was run in chloroform:methanol:water (65:25:4, v/v/v). Second dimension (from left to right) was run in chloroform:methanol:29% ammonium hydroxide (65:25:4, v/v/v). Autoradiography was used to visualize the incorporation of 3H-ethanolamine into PME, PE, and PC. O: origin. F1/F2: solvent front for dimension 1/2.

