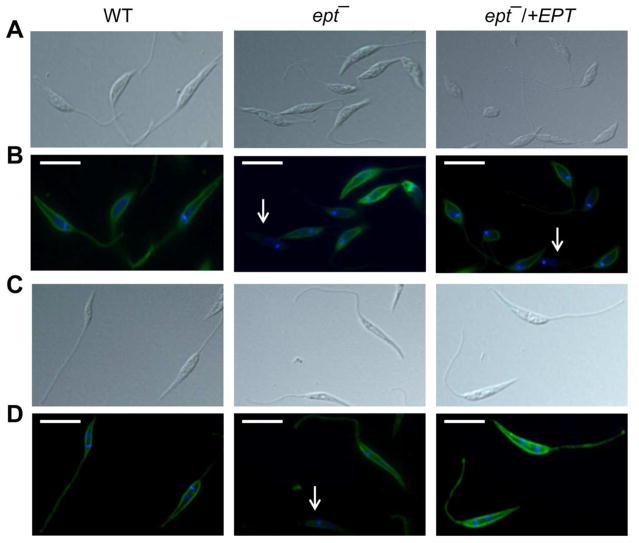
Figure 5. Uneven distribution of LPG in ept− mutants.
Log phase (A, B) or stationary phase (C, D) promastigotes of WT, ept−, and ept−/+EPT were labeled with the anti-LPG monoclonal antibody WIC79.3 and subjected to immunofluorescence microscopy. A and C: DIC images; B and D: overlay of LPG labeling (green) and DNA staining (blue). White arrows indicate cells with low or undetectable LPG. Scale bars: 10 μm.

