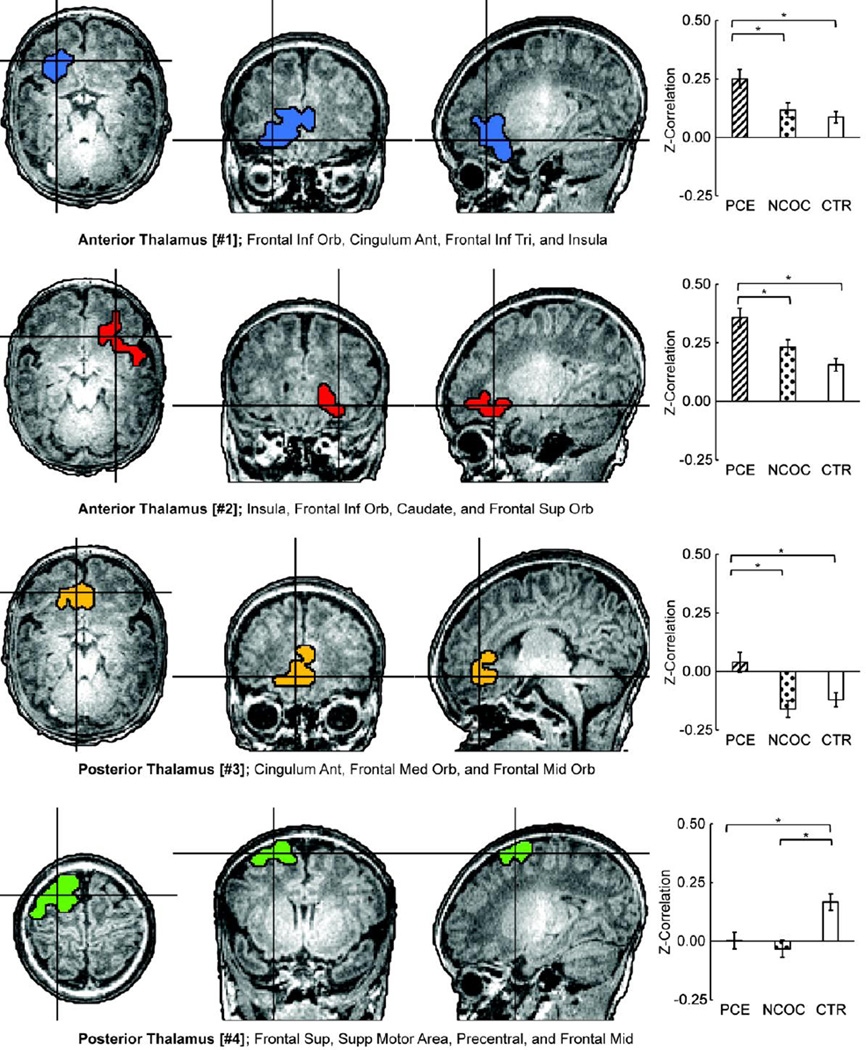
Figure 2. Localization of group-wise (PCE, NCOC, CTR) functional connectivity differences at the cluster-level and post-hoc comparisons by group.
(Left) Clusters depicted on the high-resolution anatomical reference image. Two clusters were detected for each seed region (anterior and posterior thalamus, four total; #1–4). Clusters were detected using the combined threshold approach controlling for gestational age, gestational weight, scan age, gender, and scanner (α < 0.05): multivariate group-wise difference (PCE, NCOC, and CTR) p ≤ 0.01, minimum number of voxels = 32, third-nearest neighbor clustering (i.e. voxels cluster together if faces, or edges, or corners touch). List of areas include AAL regions with approximately 10% or greater cluster-overlap. (Right) Comparisons of functional connectivity within cluster by subgroup. (*) indicate significant (p ≤ 0.05 dunn-sidak corrected) pair-wise differences between groups while accounting for participant characteristics mentioned above. Data plotted as mean ± s.e.m.

