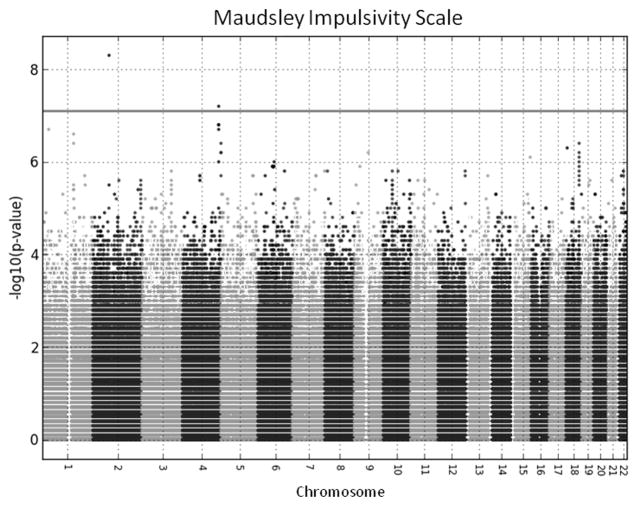
Figure 1. GWAS of impulsivity results.
Manhatten plot of the -log10 p-values for the tests of association between single variants and the Maudsley Impulsivity Scale. Variants are ordered according to chromosomal position, and the p-values are alternately shaded light and dark gray to differentiate between variants on adjacent chromosomes.

