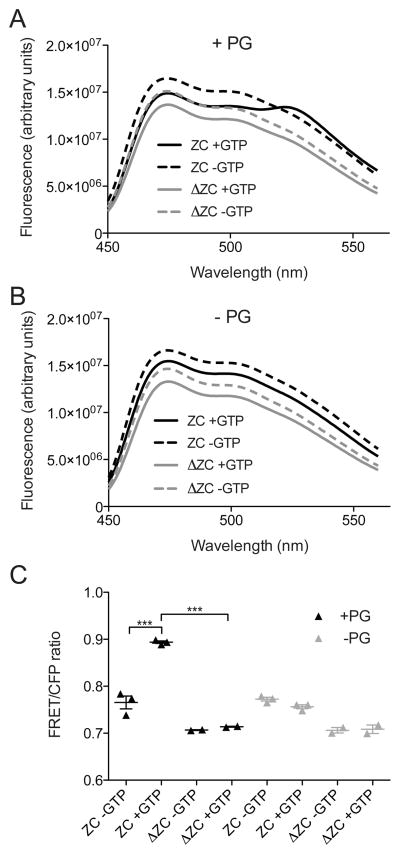
Figure 4. FzlC and full length FtsZ, but not FtsZΔCTC, display FRET with GTP and PG vesicles in vitro.
(A, B) Emission profiles of YFP-FzlC and FtsZ-CFP or FtsZΔCTC-CFP ± GTP in the presence (A) or absence (B) of PG vesicles after excitation at 435 nm. (C) FRET/CFP ratios of YFP-FzlC and FtsZ-CFP or FtsZΔCTC-CFP ± GTP in the presence or absence of PG vesicles. Error bars represent the mean FRET/CFP ratio ± SEM from three experimental replicates for reactions containing FtsZ-CFP and from two experimental replicates for reactions containing FtsZΔCTC-CFP, *** = p< 0.001, one-way ANOVA. Labels: ZC = FtsZ-CFP/YFP-FzlC, ΔZC = FtsZΔCTC-CFP/YFP-FzlC

