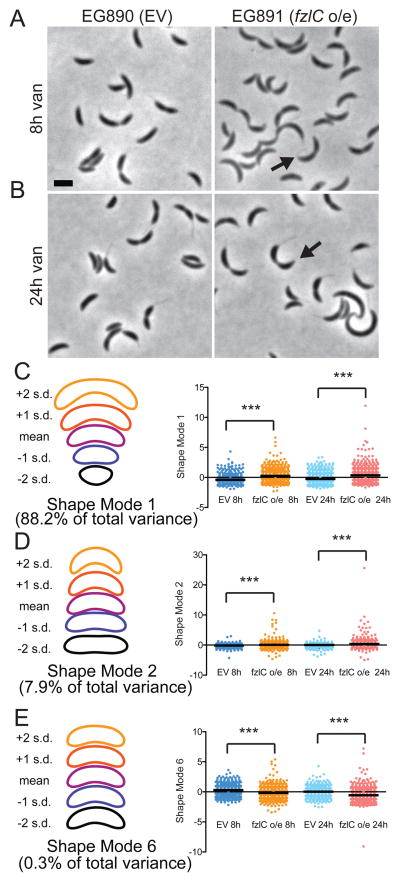
Figure 5. High levels of FzlC interfere with efficient cytokinesis.
(A,B) Phase contrast micrographs of cells containing empty vector (EG890) or vanillate-inducible fzlC overexpression vector (EG891) grown for 8 or 24 h in the presence of vanillate. The black arrows denote pointy poles (shape mode 6). Scale bar = 2 μm. (C–E) PCA of EG890 and EG891 produced seven different shape modes. Shown are scatter plots of shape modes 1, 2 and 6, which roughly correspond to length, curvature, and pole shape, respectively. Contours reflecting the mean shape and ± 1 or 2 standard deviations (s.d.) from the mean in each shape mode are shown to the left of the corresponding scatter plot. The differences between EG890 (n = 582 and 752 cells at 8 and 24 h, respectively) and EG891 (n = 658 and 817 cells at 8 and 24 h, respectively) were statistically significant for these three shape modes (*** = p < 0.001, Bonferroni’s Multiple Comparison Test).

