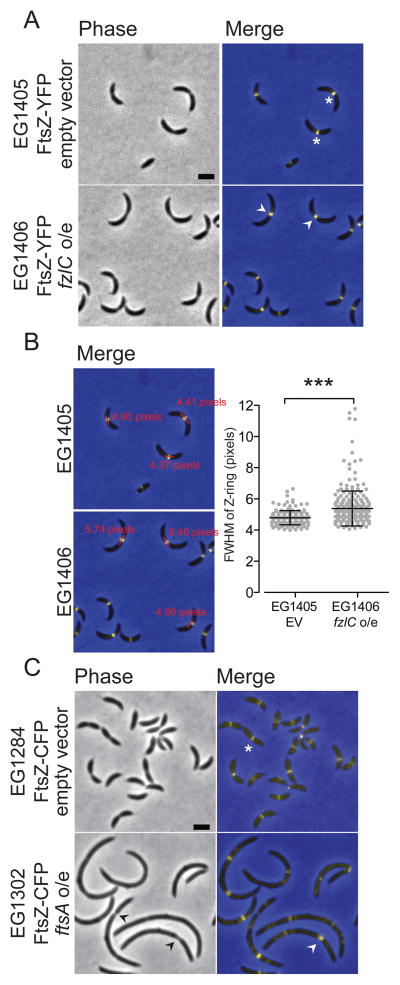
Figure 6. High levels of FzlC broaden the Z-ring in constricting cells.
(A) Phase contrast and merged fluorescent micrographs of cells containing xylose inducible ftsZ-yfp with an empty vector (EG1405) or vanillate-inducible fzlC overexpression vector (EG1406) grown in the presence of vanillate for 24 h and xylose for 1 h. The white asterisks denote focused Z-rings and white arrowheads denote more broad Z-rings at extended division sites. (B) Merged fluorescent micrographs from (A) with representative line scan full width half maximum (FWHM) measurements. Scatter plot shows the FWHM of Z-rings in cells with visible constrictions for EG1405 (n = 163) and EG1406 (n = 262) (*** = p < 0.001, unpaired t-test). (C) Phase contrast and merged micrographs of cells containing vanillate inducible ftsZ-cfp with empty vector (EG1285) or xylose-inducible ftsA overexpression vector (EG1302) grown in the presence of xylose for 4 h and vanillate for 1 h. The white asterisks denote focused Z-rings, the black arrowhead denotes deeply constricted sites, and the white arrowheads denote a more diffuse Z-ring. Scale bars = 2 μm.

