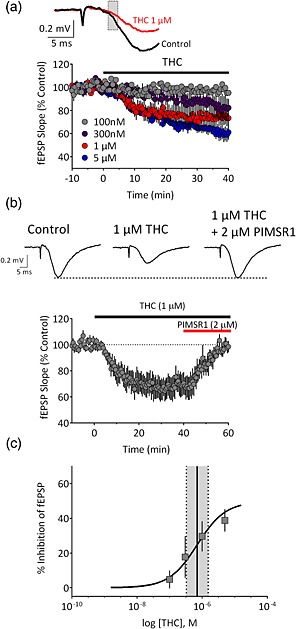
Figure 2.

Concentration‐dependent inhibition of hippocampal glutamate release by Δ9‐tetrahydrocannabinol (THC). (a) Time course of the inhibition of the initial slope of fEPSPs (indicated by shaded box in upper traces) by Δ9‐THC across concentrations, applied at the time indicated by the horizontal bar. (b) Upper, representative averaged traces (n = 5–7 sweeps) demonstrating the effect of Δ9‐THC and reversal of its effects by the neutral CB1 antagonist PIMSR1. Lower, summary time course of recordings (n = 7 recordings) demonstrating the reversal of Δ9‐THC effects by PIMSR1. (c) Concentration–response curve for Δ9‐THC (n = 6–7 slices per concentration). The EC50 (solid line) was calculated to be 707 nM. Dashed lines indicate the 95% confidence interval. [Colour figure can be viewed at http://wileyonlinelibrary.com]
