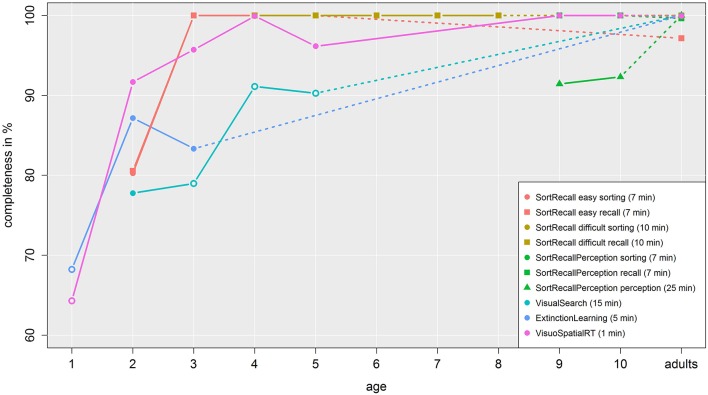
Figure 8.
Completeness of data. This figure shows to what extent we were able to collect data at each age. Each line represents one task in one study, while the legend includes the duration of each task. The dashed line connects children with adult data. Empty symbols denote a significant difference between children and adult data.

