FIGURE 1.

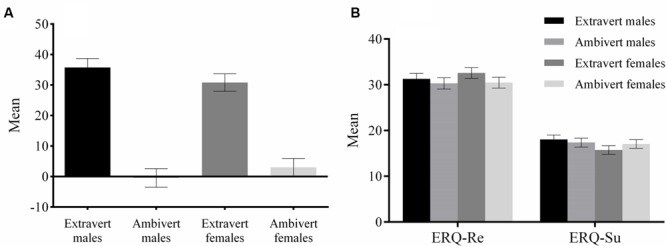
Means of the scores on the Extraversion subscale of the NEO-FFI (A) and ERQ (B) for the four groups. The error bar represents standard error.

Means of the scores on the Extraversion subscale of the NEO-FFI (A) and ERQ (B) for the four groups. The error bar represents standard error.