FIGURE 3.

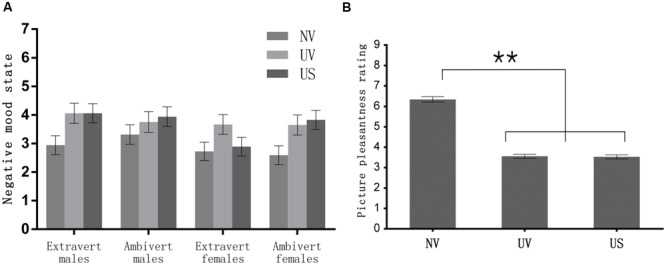
The results of mood rating for each condition (A), and Means of the picture pleasantness assessment in each condition (B). ∗∗p < 0.001.

The results of mood rating for each condition (A), and Means of the picture pleasantness assessment in each condition (B). ∗∗p < 0.001.