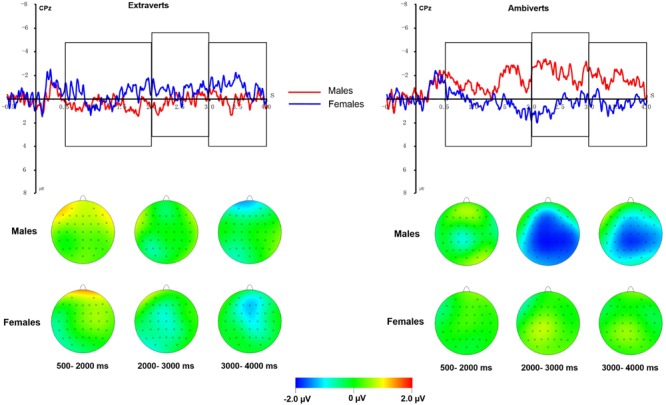
FIGURE 5.

(Top) US-UV difference waveform at CPz for males (red) and females (blue) in the extravert and ambivert samples. (Bottom) Topographical maps of the voltage amplitudes of US-UV difference waves for males and females in extraverts and ambiverts from 500 to 4000 ms post stimulus.
