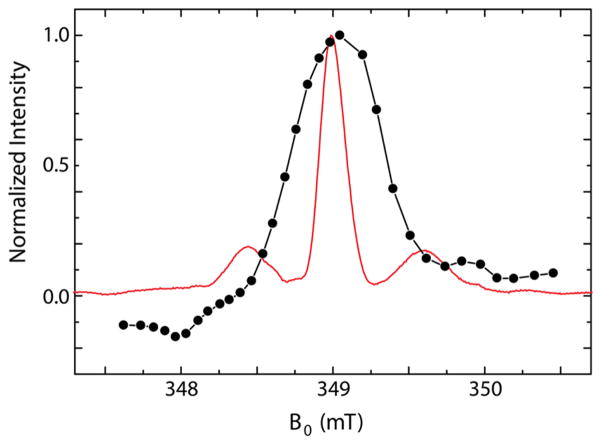
Figure 4.
Zeeman field profile. Field dependence of the 1H NMR signal enhanced by NOVEL DNP (black dots, black line to guide the eye) together with the echo-detected EPR spectrum (red line) of a 10.5 mM trityl OX063 sample. The echo-detected EPR spectrum was recorded at a microwave frequency of 9.7837 GHz. The central peak occurs at 348.98 mT, which corresponds to a 1H Larmor frequency of 14.859 MHz. To acquire the profile, we performed NOVEL experiments at this magnetic field, while the microwave frequency was swept. To compare the field profile to the echo-detected EPR spectrum we transformed the microwave frequency values to magnetic field values.

