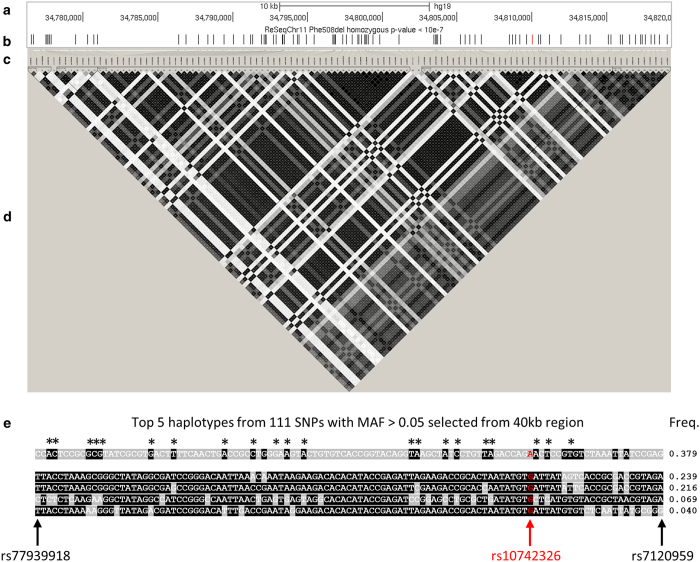
Figure 2.
Linkage disequilibrium (LD) and haplotype structure around top cystic fibrosis (CF) lung disease-associated region. The upper panels (a–d) show the entire CF lung disease severity association region, whereas the lower panel (e) indicates the LD structure and the top 5 haplotypes of single-nucleotide polymorphisms (SNPs) with the most significant association P value (<10−7). The sections are: (a) scale bar and genome coordinates on chr11 of University of California Santa Cruz (UCSC) hg19 reference genome; (b) CF lung disease severity association P values; (c) LD plot SNP locations with respect to the genome coordinates in (a) (upward tick marks) that are then mapped to the LD plot in (d) (slanted lines); (d) LD plot generated by Haploview; (e) haplotype structure with allele genotypes and frequencies; the first SNP (rs77939918) and last SNP (rs7120959) are labeled in black font with black arrows at the bottom; the SNP of highest significance (rs10742326) is labeled in red font with a red arrow. Asterisks (*) indicate common alleles observed in the top five haplotypes.

