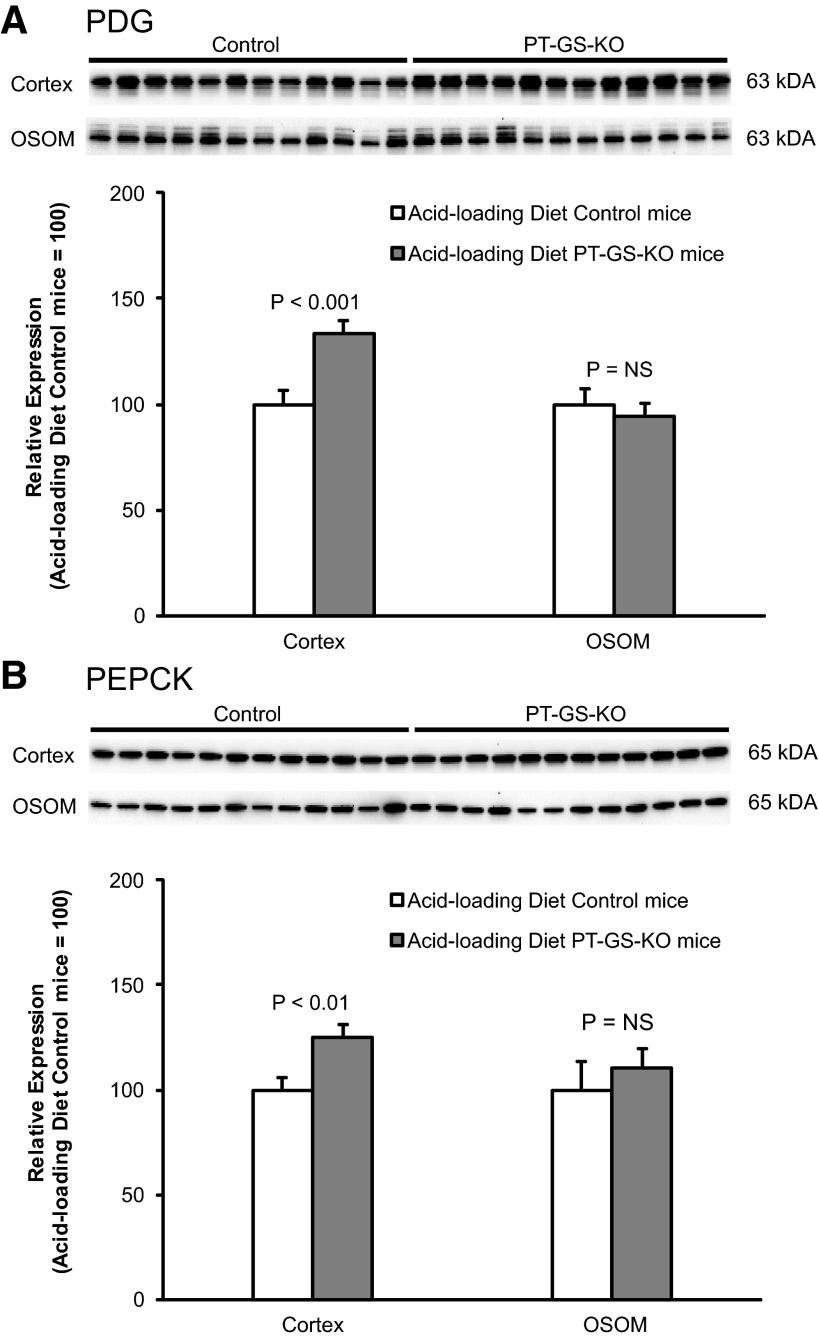
Fig. 11.
Effect of PT-GS-KO on renal PDG and PEPCK expression in acid-loaded mice. Top: effects of PT-GS-KO on PDG expression by immunoblot analysis. In the cortex, PDG expression was significantly greater in PT-GS-KO mice than in control mice. Bottom: effects of PT-GS-KO on PEPCK expression. In the cortex, PEPCK expression was significantly greater in PT-GS-KO mice than in control mice. Values are means ± SE; n = 12 mice/genotype.

