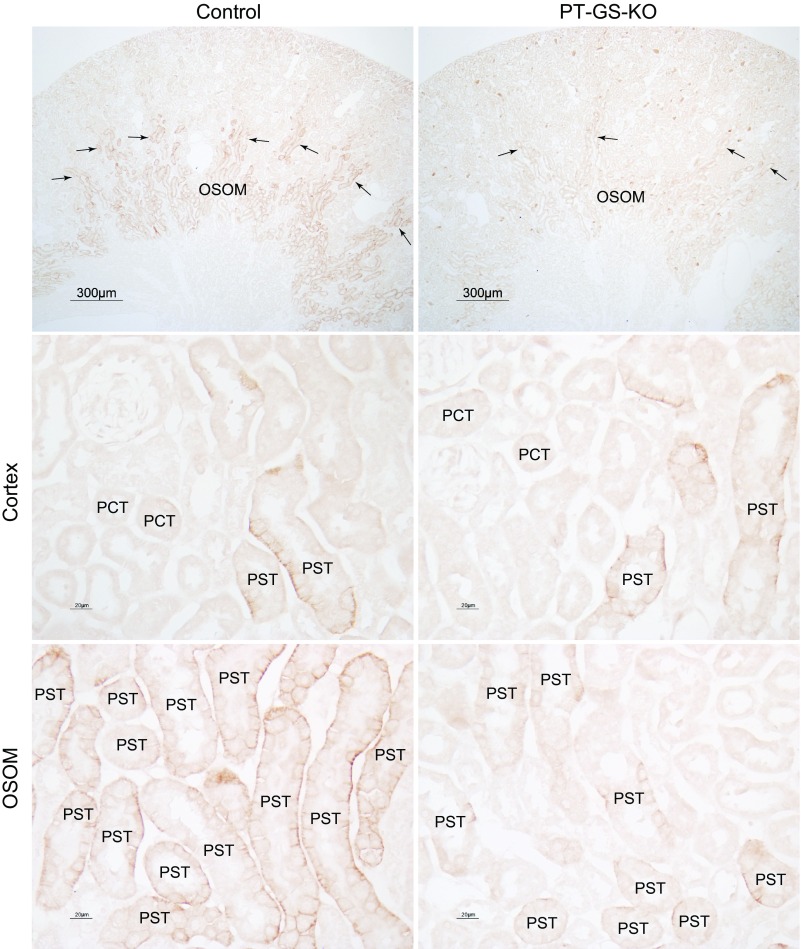
Fig. 6.
Effect of PT-GS-KO on SN1 expression in mice fed a normal diet. Top: low-power micrographs of SN1 immunolabel in control and PT-GS-KO kidneys. Strong SN1 immunoreactivity was evident in the OSOM and extended into the medullary rays (arrows) in the deep inner cortex of control kidneys. In PT-GS-KO, SN1 immunoreactivity in these regions was markedly reduced. Middle: high-power micrographs of basolateral SN1 immunolabel in the midcortex. Although SN1 immunolabel was decreased by PT-GS-KO in the PST in the deep inner cortex, in the mid and outer cortical PST, SN1 immunolabel was not appreciably different between control and PT-GS-KO mice. SN1 label in the PCT was negligible in both genotypes. Bottom: SN1 immunolabel in the OSOM. In PSTs in the OSOM, SN1 immunoreactivity was less intense than in mice with PT-GS-KO compared with control mice.

