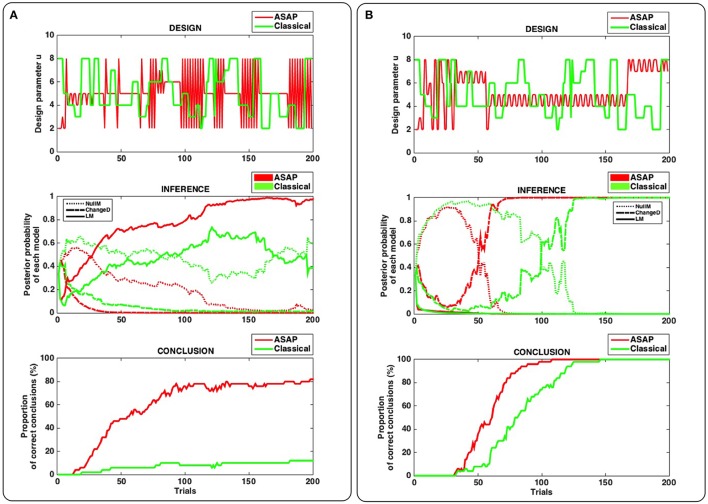
Figure 2.
Results of synthetic experiments comparing ASAP with a classical (static) design (see main text for details). (A) True model used for simulation = “Learning” model (LM). (B) True model used for simulation = “Change Detection” model (ChangeD). Top panel: single example of a stimulation sequence produced by ASAP (red) and by a roving-type classical design (green). Middle panel: dynamics of model posterior probabilities over trials, for the example shown in the top panel. For each experimental design, the plain, dashed and dotted lines correspond to models LM, ChangeD, and NullM, respectively. Bottom panel: Proportion of correct conclusions over the 50 simulated experiments for each design.

