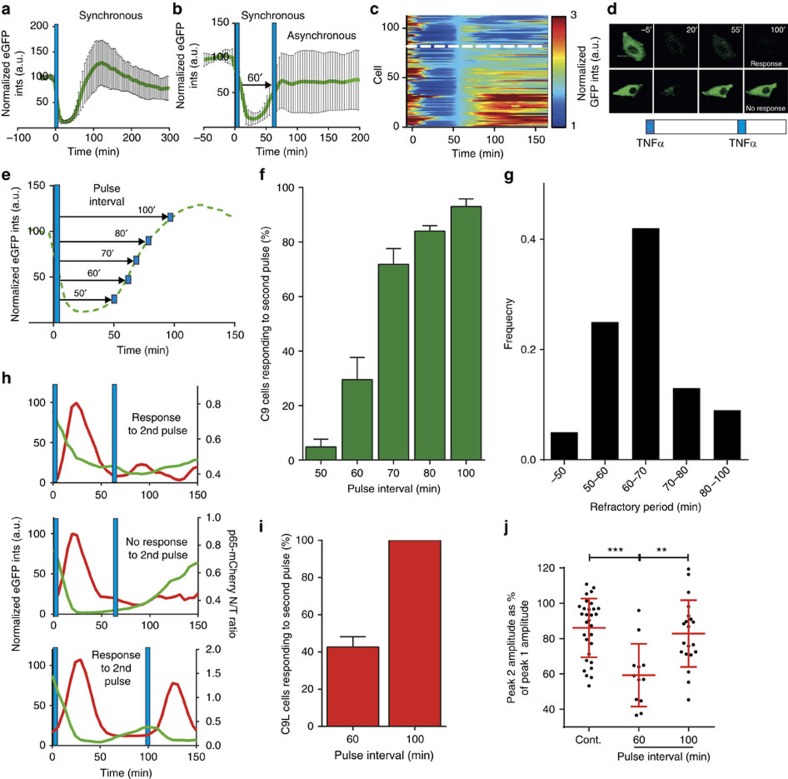
Figure 2. TNFα pulsing reveals a heterogeneous refractory period in the NF-κB system.
(a) Response to a single 5-min pulse of TNFα. Shown is the mean (in green) (±s.d.) of the normalized total IκBα-eGFP intensities in single C9 cells. Timing of TNFα stimulation represented with a blue bar. (b) Response to two 5 min TNFα pulses applied at 0 and 60 min. Shown is the mean (±s.d.) of the normalized total IκBα-eGFP intensity in single C9 cells. Timing of TNFα stimulation represented with blue bars. (c) Clustering analysis of single-cell data from b with respect to normalized total IκBα-eGFP single-cell intensities at the time of the second pulse. Broken line indicates responding (top) and non-responding (bottom) clusters. (d) Confocal images of representative non-responding (top) and responding (bottom) cells from c. The IκBα-eGFP signal shown in green colour. Scale bar, 10 μm. (e) Schematic representation of repeat pulsing: Two 5 min TNFα pulses applied at time intervals ranging from 50 to 100 min. Green dotted line represents a putative IκBα-GFP response to the first TNFα pulse. (f) Fraction of C9 cells responding at different TNFα pulse intervals. Single-cell responsiveness (means ±data range of at least two replicates) based on clustering analysis of normalized single-cell total IκBα-eGFP intensities (as in c). (g) Distribution of refractory periods based on data in f. (h) Representative C9L cells stimulated with TNFα pulses at 60 and 100 min intervals (as depicted with blue bars). Shown are normalized total IκBα-eGFP intensities (in green) and the nuclear to total (N/T) ratio of the p65-mCherry signal (in red). (i) Fraction of responding C9L cells at 60 and 100 min pulse interval. Shown is mean±data range per condition. (j) Amplitude of the second NF-κB translocation. Shown are C9L cell responses to continuous, as well as 5 min TNFα pulses at 60 and 100 min intervals, respectively, with mean ±s.d. of the second peak (P2) nuclear NF-κB p65-mCherry translocation amplitude, expressed as a fraction of the first-peak amplitude. Statistical difference assessed with a Student's t-test (**P value<0.01, ***P value<0.001).

