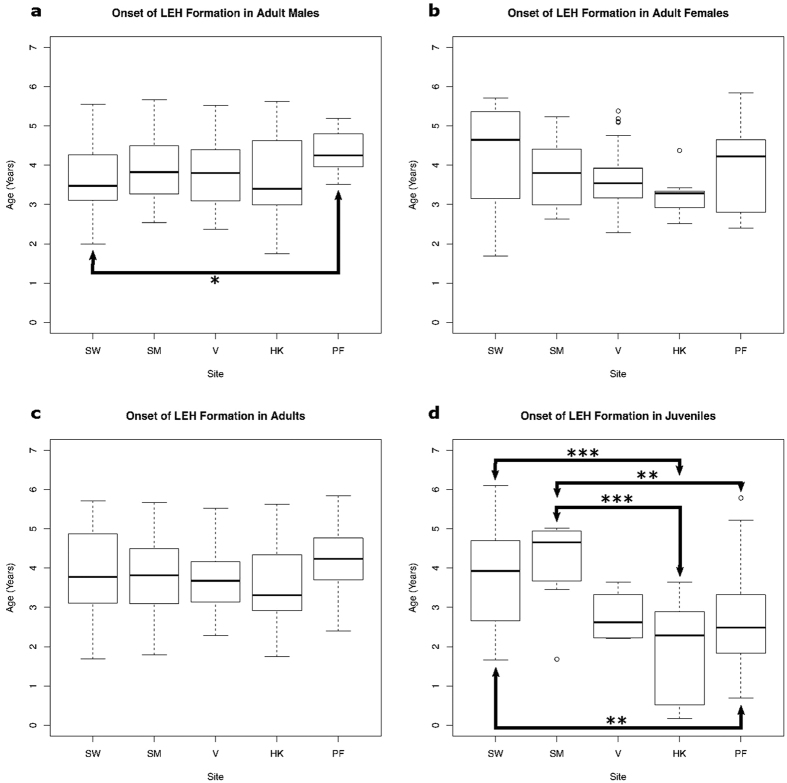
Figure 3. Boxplots of variation in age at onset of hypoplasia formation within each population.
Populations are arranged geographically proceeding from west to east. Connecting arrows indicate statistically significant differences between paired populations (*p < 0.02, **p < 0.01, ***p < 0.001). Pairwise comparisons with a p-value of 0.02 or greater are not considered statistically significant due to the high probability of this value occurring by chance when all five pairs are compared. All significant differences involve one or both of the populations from the western LBK. In the juvenile subset, both populations from the western LBK show a later average onset than the more easterly populations. SW - Schwetzingen; SM - Stuttgart-Mühlhausen; V - Vedrovice; HK - Nitra-Horné Krškany; PF - Polgár-Ferenci-hát.

