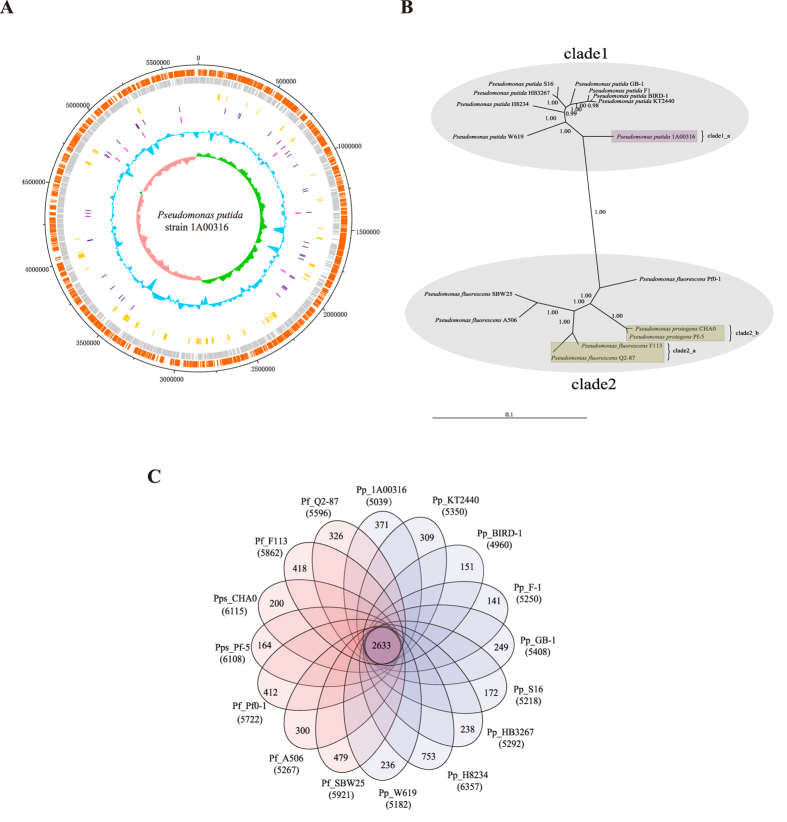
Figure 1. Genomic features and a comparative genomic analysis of Pseudomonas strains.
(A) Circular plot of the P. putida 1A00316 chromosome. Circles are numbered from 1 (outermost) to 8 (innermost). Circle 1 represents the whole chromosome; Circles 2 and 3 show the locations of predicted CDSs on the positive and negative strands, respectively; Circle 4, genomic islands; Circle 5, tRNA genes; Circle 6, rRNA genes; Circle 7, %G + C; Circle 8, GC skew ((G−C)/(G + C)). (B) Phylogenetic tree depicting the relationships among 16 Pseudomonas strains. The values shown at interior nodes represent clade credibility, which is the likelihood of the clade based on the posterior probability values generated using MrBayes. (C) Genomic diversity of 16 Pseudomonas strains. Each strain is represented by an oval. The number of orthologous coding sequences (CDSs) shared by all strains (i.e., the core genome) is shown in the center. Overlapping regions show the number of CDSs conserved only within the specified genomes. Numbers in non-overlapping portions show the number of CDSs unique to each strain. The total number of protein-coding genes within each genome is listed below the strain name.

