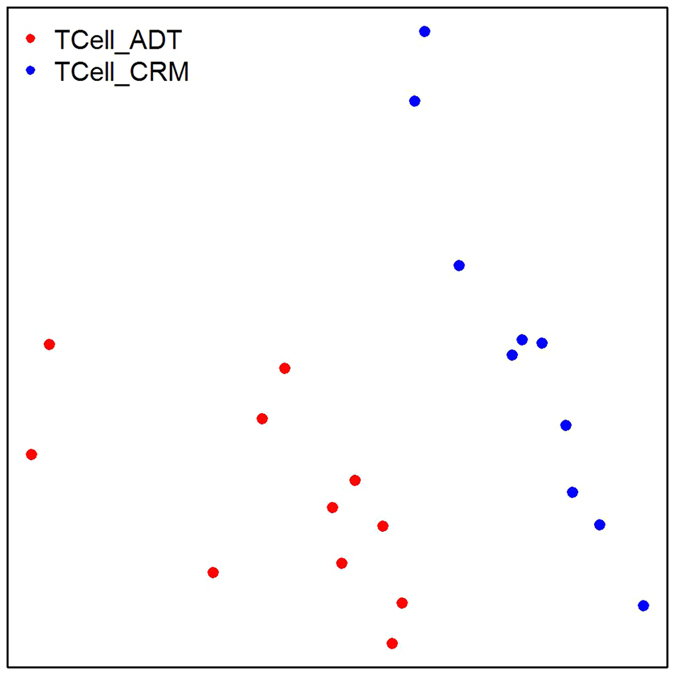
Figure 3. Multidimensional scaling analysis plot for the comparison of ADT (red) and CRM (blue) samples from RNASeq on CD4+ T cells.

Euclidean distance was used to measure between samples dissimilarities over gene expression values. Two clusters are formed clearly separating the two groups of JIA patients (TCell_ADT versus TCell_CRM).
