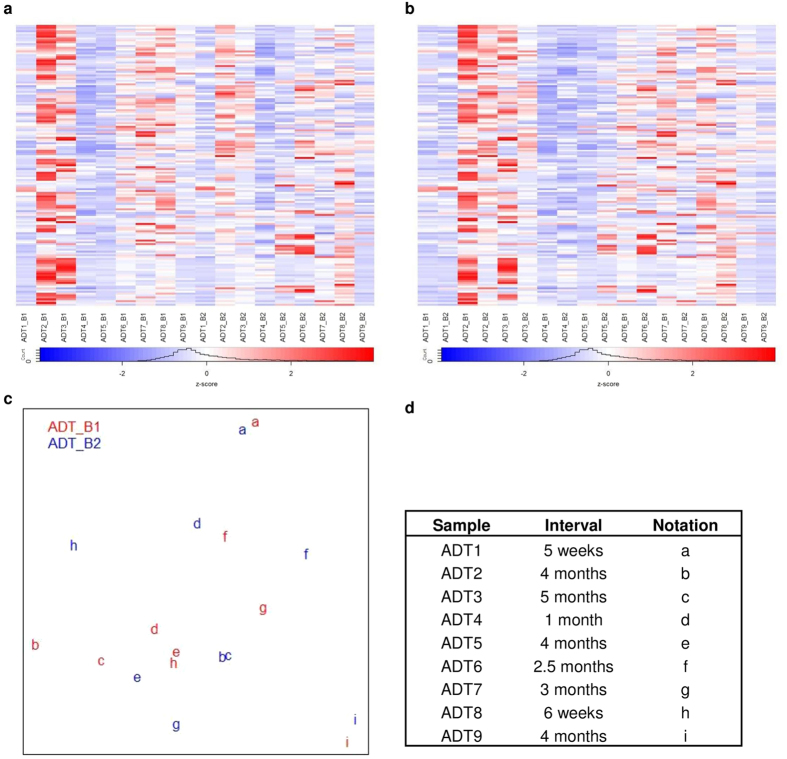
Figure 4. Heatmap of top 1% genes with the largest fold change calculated by voom after sample weighting over normalized gene expressions for cohort B ADT samples.
(a) Heatmap columns are sorted by time point (B1, B2), (b) Heatmap columns are sorted by pair sample of two time points. Rows of heatmap represent gene expression values and column shows sample label (patientID_timePoint). (c) Multi dimensional scaling (MDS) plot of gene expression for cohort B ADT samples, red is sample of first time point and blue indicates second time point sample, same subject is represented by identical letter. (d) Information of ADT samples corresponding to their intervals across two time points and their notations in MDS plot. Majority of pair samples are alike in their transcription levels despite their medication time course. No significant gene could used to classified ADT samples by medication time course and majority of the identical sample pairs display similar transcription patterns.

