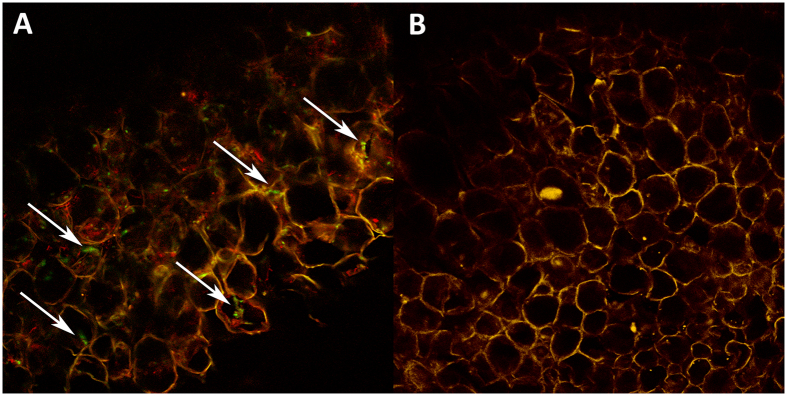
Figure 4. Confocal microscopy of root sections treated with antiGFP-AF 488.
Visualised using a ×100 objective lens. Arrows show hyphae (green) of GFP-expressing isolate ELDO17-Amgpd-xiGFP2 (A). Hyphae of non-expressing isolate ELDO17-siGFP1 were not visible at the same wavelength, 488 nm (B). Although most plant cell walls were typically red, some were yellow (A,B), due to autofluorescence at 488 nm, which was visible in roots inoculated with both GFP, mRFP, and non-expressing isolates, regardless of treatment.

