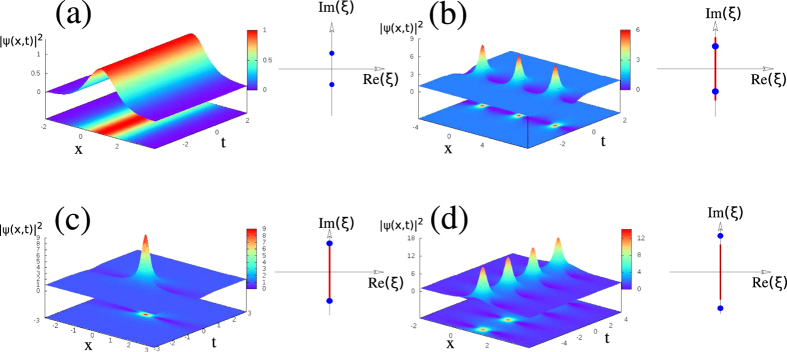
Figure 1. Analytical results from the IST theory.
Spatio-temporal evolution (left) and spectral portraits (right) of (a) the fundamental soliton, (b) the Akhmediev breather, (c) the Peregrine soliton and (d) the Kuznetsov-Ma soliton. The red lines in spectra plotted in (b–d) represent branchcuts. The blue points in (a–d) represent complex conjugate double points.

