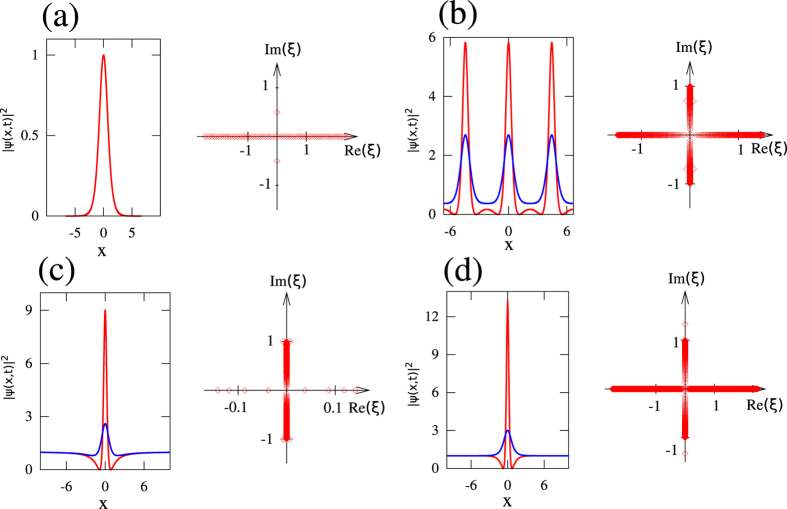
Figure 2. Numerical IST analysis of some soliton solutions of the 1D-NLSE.
Spatial profiles (left) and spectral portraits (right) computed from numerical simulations for (a) the fundamental soliton  , (b) the Akhmediev breather (Eq. (6), ϕ = π/4), (c) the Peregrine soliton (Eq. (6), ϕ = 0) and (d) the Kuznetsov-Ma soliton (Eq. (7), φ = π/4). The red lines represent power profiles
  at t = 0 and the blue lines represent power profiles
  at t = 0.5. Red open squares represent IST spectra that are numerically computed both at t = 0 and at t = 0.5, thus showing that spectral portraits are time-independent. A numerical box of size L = 500 discretized by using 10000 points has been used to compute spectra plotted in (b–d).

