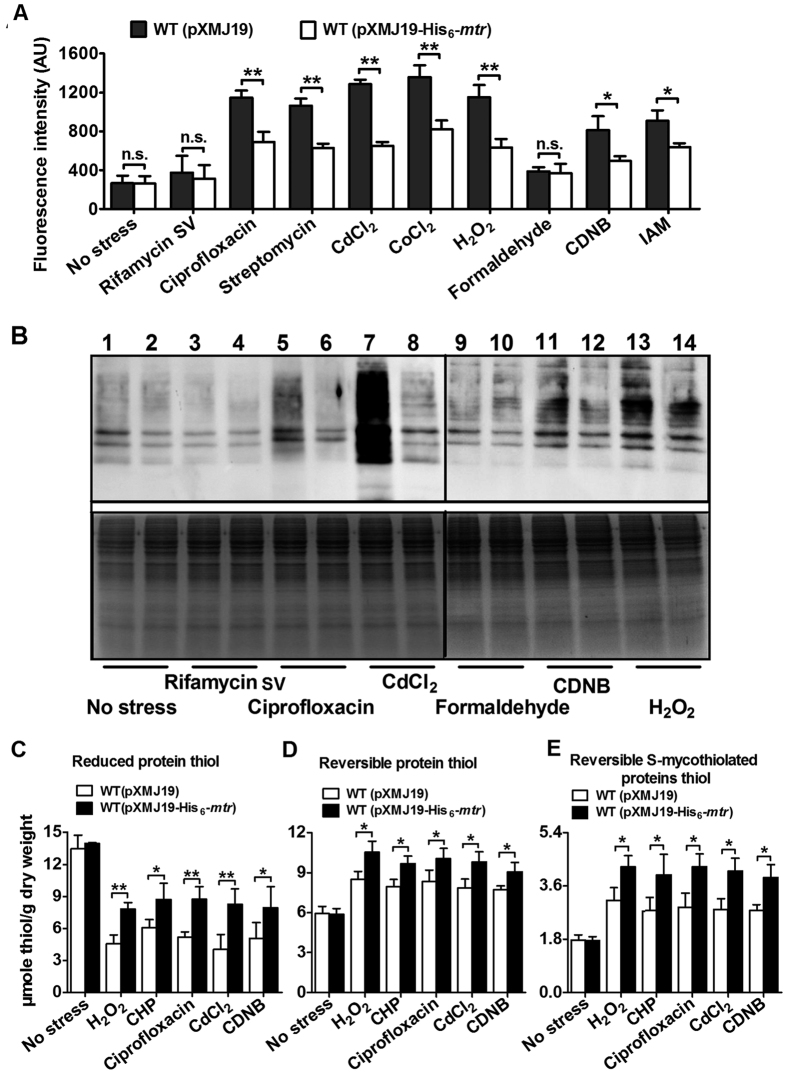
Figure 5. Overexpression of Mtr reduces ROS production under oxidative stress conditions.
(A) ROS levels in C. glutamicum strains expressing Mtr were measured using the DCFHDA fluorescence determination assay after exposure to indicated reagents. Bars represent the fluorescence intensity in arbitrary units (AU). Mean values with standard deviations (error bars) from at least three independent experiments are shown. n.s.: not significant. *P ≤ 0.05. **P ≤ 0.01. (B) Protein carbonyl contents were analysed by Western blotting with an anti-DNPH antibody after exposure to various stressors for 30 or 60 min at 30 °C. A parallel run stained with Coomassie Brilliant Blue is shown in the bottom panel. Total proteins were extracted from vector-expressing (lanes 1, 3, 5, 7, 9, 11, and 13) and mtr-expressing (lanes 2, 4, 6, 8, 10, 12, and 14) C. glutamicum cells. (C–E) Analysis of protein thiols. Proteins were extracted from WT(pXMJ19) and WT(pXMJ19-His6-mtr) cells before and after exposure to multiple stressors. Reduced protein thiols (C), reversible protein thiols (D), and reversible S-mycothiolated proteins thiols (E) were quantified using DTNB as described in “Methods”. Mean values with standard deviations (error bars) from at least three independent experiments are shown. *P ≤ 0.05. **P ≤ 0.01.

