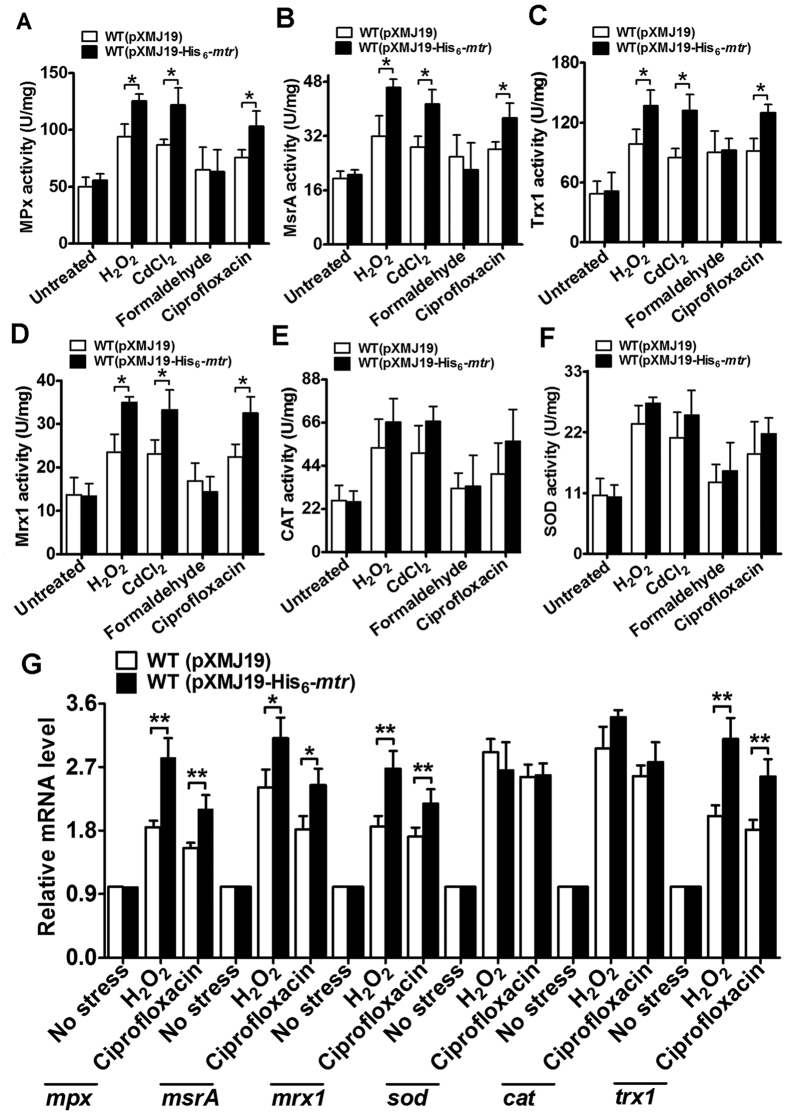
Figure 7. Activity and expression level of antioxidant enzymes.
(A–F) Activities of antioxidative enzymes. Bacterial cells grown to stationary phase were exposed to 100 mM H2O2, 20 mM formaldehyde, 0.3 mM CdCl2, 70 mM CDNB, and 375 μg/ml ciprofloxacin for 30 or 60 min at 30 °C. Crude protein extracts were prepared and then used to measure enzyme activity. Each enzyme activity is represented as U/mg of protein. Mean values with standard deviations (error bars) from at least three independent experiments are shown. *P ≤ 0.05. (G) The WT(pXMJ19) and WT(pXMJ19-His6-mtr) strains grown to mid-log phase were exposed to multiple stressors for 30 min at 30 °C. The levels of indicated gene expression were determined by qRT-PCR. The mRNA levels were presented relative to the value obtained from cells without treatment. The values represent the mean results from three independent cultivations, with standard errors. *P ≤ 0.05. **P ≤ 0.01. CAT, catalase; SOD, superoxide dismutase; MPx, mycothione peroxidase; Mrx1, mycoredoxin 1; MsrA, methionine sulfoxide reductase A; Trx1, thioredoxin 1.

