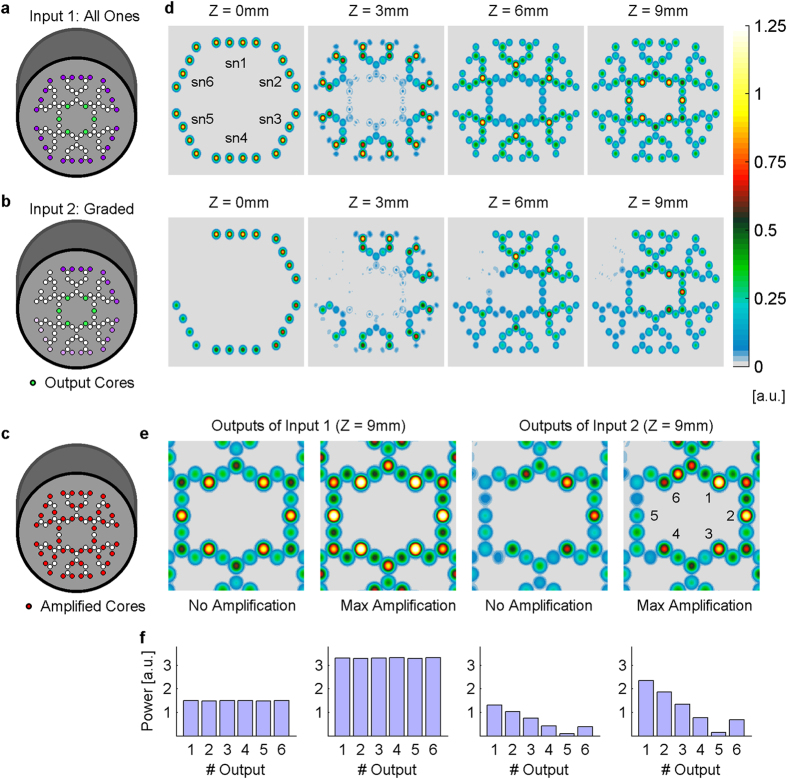
Figure 5. Transmission in the network for various input patterns.
Two input patterns are compared: (a) “all 1” where all inputs are maximal, and (b) “graded” where the inputs of each subnet have a fixed power of [100% − (n − 1) * 20%], where n is the subnet number. (c) Simulation results of the two different input patterns at various z values with no amplification shows the circular symmetry in the “all 1” inputs, and the power gradient preservation along the z-axis in the graded input. (d) Illustration of all amplified synaptic-like cores. (e) Addition of amplification results in similar output ratio with additional “DC” power. (f) Quantified results of each output core clearly demonstrate that amplification does not affect the ratios between outputs in these two examples. Notice that core 6 has lower power than expected due to its averaged inputs (50% as the inputs of core 3).

