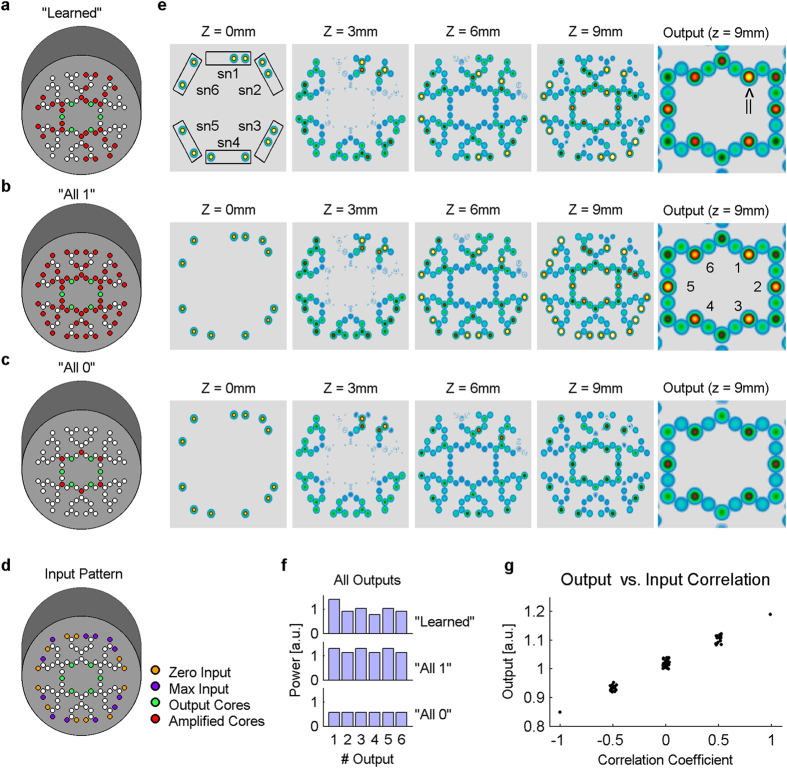
Figure 6. A network that classifies input patterns.
(a) “Learned” is a specific amplification map which mimics a device after training for a specific searched input vector ‘00111100’ and is replicated 3 times within the network. (b) A control “all 1” homogeneous amplification map contains no embedded information. (c) A homogeneous control “all 0” amplification map also contains no embedded information. (d) Three 8-bit input vectors are tested simultaneously: the searched pattern is tested at output 1 (presented to sn1+sn2 subnets), and two control vectors are tested at output 3 (sn3+sn4), and output 5 (sn5+sn6). (e) Simulation results of 3 vectors with 3 amplification maps shows that only the “learned” amplification map distinguishes the searched vector from the rest. (f) Quantified output power of the three simulations demonstrates the difference between output 1 and outputs 3 and 5. (g) Simulation of all possible 8-bit input vectors with 4 “zeros” and 4 “ones” with the “learned” configuration: the output power grows larger as its 8-bit input is more similar to the “searched” pattern (higher coefficient of correlation).

